Download
1 / 11
140 likes | 430 Vues
Food Consumption Scores and Food Consumption Groups. Creation and Validation. Data Analysis plan. Create the Food Consumption Score Group foods by category (cereals, pulses, vegetables, fruit, meat & fish, milk, sugar, oil

E N D
Food Consumption Scores and Food Consumption Groups Creation and Validation
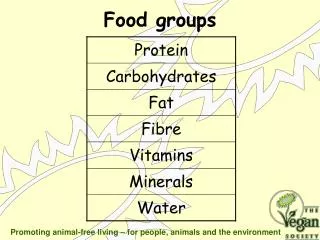
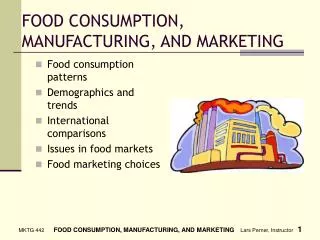
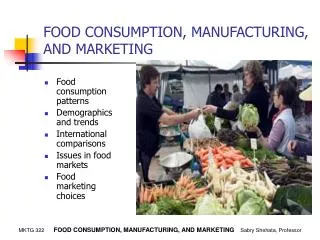
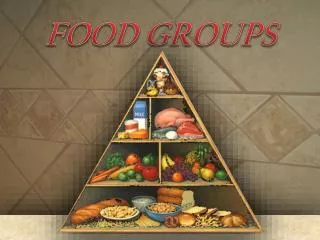
Data Analysis plan • Create the Food Consumption Score • Group foods by category (cereals, pulses, vegetables, fruit, meat & fish, milk, sugar, oil • Create the score based on frequency of consumption by group times weight of each group and summing each group • Validate the FCS as a Food Security Indicator • Correlation with various other indicators • Create Food Consumption Groups to answer: Who are the food insecure? How many are they? Where are they? Why are they insecure? • Create basic statistics on how many in each group • Explore further who they are by various strata (agro-ecological zone, governate, urban vs. rural, etc)
FCG Thresholds • An FCS of 21 in Yemen is composed of oil, sugar and cereals (staple) • Because the value of sugar and oil consumption was daily (7 times a week), we have used a higher threshold for grouping. In order to properly evaluate this high sugar and oil diet as poor, we have changed our thresholds as follows: • Poor < 28 • Borderline 28.5 – 42 • Acceptable >42.5
FCG by Governate • Rayma, Ad Daleh, Amran and Al Marha show the highest proportion of poor food consumption group
FCG by Household Status *The difference between Poor and Borderline in regards to high dependency was not found to be statistically significant
Conclusions • FCS is strongly correlated with other key food security indicators • The dietary patterns of the poorest households (in terms of food consumption) are highly reliant on sugars and oil • Generally, rural households are worse off as are households in the North Highlands • More analysis is needed to further profile the most food insecure