Download
1 / 36
360 likes | 521 Vues
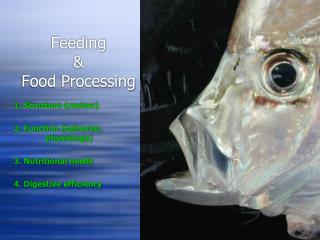
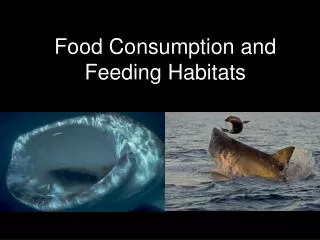
Food Consumption and Feeding Habitats. Introduction. Knowledge of prey consumption and food processing is basic Rates of consumption, feeding pattern, and digestion studied in few species Distinctive morphology (spiral valve intestine) might influence digestion, absorption, etc. Diet.

E N D
Introduction • Knowledge of prey consumption and food processing is basic • Rates of consumption, feeding pattern, and digestion studied in few species • Distinctive morphology (spiral valve intestine) might influence digestion, absorption, etc.
Diet • Early studies = lists of prey • Frequency of Occurrence (O) • Total number of specific prey (N) • Total weight of specific prey (W) • Volume of specific prey (V) • Problems associated with each one
Cortes 1997 & 1999… • Combination of several factors • Index of Relative Importance • IRI: %F (%W + %N) Still controversial but, useful in comparisons
Limitations of stomach contents • Rate of digestion vary with size and type of prey • Problems with capture techniques • Food regurgitated when captured at depth or captured using gill nets Perhaps: determine diet in energetic terms (again, limitations)
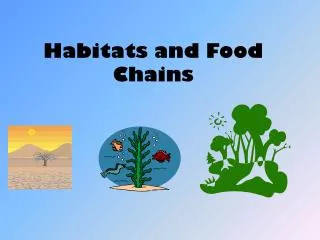
Dietary Groups of Elasmobranchs • All are carnivorous • Wide variety of prey plankton whales
Mollusks Worms
Sea lions Whales Teleosts
Sea birds Sea turtles
Diet Shifts • Some ontogenetic changes occur • from a diet of inverts to a diet with teleosts and other elasmos, mammals, and birds • Other times no change
Dietary Differences • Geographic differences • Habitat type • Water depth • Seasonal variations • Sex
Feeding relationships • Overlap among sympatric species (low to high) • Competition between consecutive size classes • Competition between same size classes • High overlap in adjacent areas
Generalized vs. Specialized • Top predators = generalists • Others (skates/rays) = specialists • Variation tends to increase with size and age or decreases in size and age
Feeding patterns • Must know more than just diet • Frequency, weight, stage of digestion, gastric evacuation dynamics of each item • Analysis of stomach contents interferes with feeding patterns • High frequency of empty stomachs = sharks are intermittent feeders • Exceptions: demersal carnivores & filter feeders
Trophic level • Accepted sharks are top predators • No quantitative estimate • Cortes, 1999 • Tertiary consumers • Stable isotopes provide further information
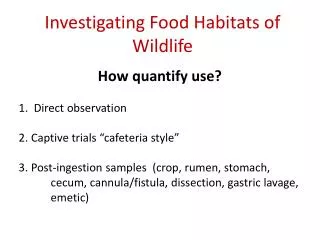
Food Consumption Rate • Determination requires regular examination of stomach contents • Difficult to determine • Influenced by many factors including age, feeding history, reproductive factors, location, habitat, water temperature, prey availability and gastric evacuation rate • Influences growth, survival, reproduction and rate of predation
Daily Ration • Amount of food consumed in a day • Expressed as a proportion of mean body weight • Wetherbee et al., 1990 determined daily ration to be a good measure for comparative studies
Estimating Daily Ration • Can be done using field methods but this requires more than examining stomach contents, you must have knowledge of gastric evacuation rates • Can be done using bioenergetic models
Bioenergetic Models • Estimate daily ration using growth rate, metabolic rate, and energetic losses • For example: Consumption = Growth + Metabolism + Urine + Feces
Gastric Evacuation Rate Is Influenced By: • Temperature (increases as temp increases) • Meal Size • Food Type • Determination by surface area models may be the most accurate for multi-prey item meals
Excretion • Losses from gill effluent and urine have not been measured in elasmobranchs they are assumed to be similar to teleost fishes at 7% of the energy budget • Difficult to measure due to the large volume of water in the habitat and the fact that some nitrogenous wastes are retained for osmoregulatory purposes
Egestion • The process of removing undigested food from the body as feces • Prolonged in elasmobranchs possibly due to the spiral valve intestine • Extended time may be related to low food consumption rate • Slow rate limits growth and reproductive rates
Spiral Valve Intestine • Primitive design • Increases digestive surface area • Conserves abdominal space for the large liver and large embryos, in an average adult human the combined length of the small and large intestine is about 8 meters, in a comparably sized shark the spiral valve is about 30 centimeters long
Spiral Valve Intestine Governs Food Consumption Dynamics Through: • Time for passage of food, slower emptying • Efficiency of absorption • Rate of consumption, decreased • Available energy for growth and homeostasis • Wetherbee and Gruber (1993) measured the average efficiency at close to 80% (similar to carnivorous teleosts)
Obstacles To Digestive Efficiency Studies • Prolonged time to evacuate a meal in elasmobranchs, from 1 to several days • Difficulty of maintaining sharks in captivity • Fecal collection is very labor intensive
Production • Increase in body mass • Methods of measurement • Lab Experiments • Field Mark and Recapture • Indirectly through size at age relationships
Relative Rates of Production • Are expressed as a percentage of body weight • Are lower in elasmobranchs than in teleost fishes • Higher in juveniles than adults • Small coastal and pelagic species have faster rates possibly due to increased risk of predation
Gross Conversion Efficiency • Efficiency of food conversion to somatic growth • Allows determination of the proportion of ingested food that will be available to the next trophic level • Decreases with age • Is believed to be comparable to teleosts
Conclusion We study what they eat, the rate of ingestion, energy processing and nutrients available in the prey to better understand energy flow through elasmobranchs to marine communities