Download
1 / 20
200 likes | 221 Vues
Retrieval of the Temperature and Humidity Profile of the Atmospheric Boundary Layer Using FTIR Spectroscopy. Narayan Adhikari University of Nevada, Reno 23 April 2010. Overview. Basics of radiation transfer in the atmosphere Atmospheric boundary layer and its evolution FTIR spectroscopy

E N D
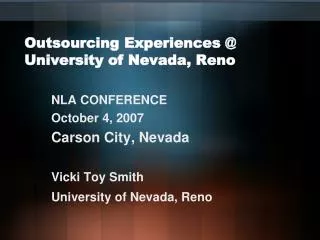
Retrieval of the Temperature and Humidity Profile of the Atmospheric Boundary Layer Using FTIR Spectroscopy NarayanAdhikari University of Nevada, Reno 23 April 2010
Overview • Basics of radiation transfer in the atmosphere • Atmospheric boundary layer and its evolution • FTIR spectroscopy • Measured IR emission spectra • Retrieval of atmospheric boundary layer profile • Conclusions • Future work
Vertical structure of atmosphere • Abundance of gases in the troposphere: • (fraction by volume in dry air) • N2: 78.1%, O2: 20.9% • Ar & inert gases: 0.936% • Green house gases: • H2O vapor: (0-2)%, • CO2: 386 ppm, CH4: 1.7 ppm • N2O: 0.35ppm, O3: 10 ppb • CFCs: 0.1 ppb • Distribution of gases: • water vapor, cloud, aerosol: 0-15 km • N2, O2, Ar, CO2: 0-90 km • O3: 15- 50 km (stratosphere) and surface • Charged ions: Ionosphere (above 50 km) thermosphere mesopause ------------------------------------------------------------- mesosphere height (km) stratopause ------------------------------------------------------------- stratosphere tropopause ------------------------------------------------------------- troposphere ------------------------------------------------------------- temperature (K) atmospheric boundary layer: 50 m - 3 km
Black body emission* Planck’s function BB emission curves at terrestrial temperatures Wien’s displacement law Stefan-Boltzmann law • Shortwave (solar radiation): 0.1 – 4 m • Longwave (terrestrial radiation): 4 -100 m (thermal IR) • The earth emits radiation at longer wavelengths (i.e. • lower energy) than the sun. • Approx. 99% of the total solar output lies in shortwave • region. • Approx. 99% of the radiation emitted by the earth and • its atmosphere lies in thermal infrared band. BB emission curves of the Sun and Earth ( scaled by a factor of 10-6 ) 90 Sun 80 T = 5780 K 70 60 (scaled by a factor of 10-6). 50 40 radiative flux ( W m-2m-1) 30 Earth 20 T = 288 K 10 0 0.1 0.2 0.4 1 2 4 10 20 50 100 wavelength (m) *Adapted from Petty, W. Grant, second edition
Energy states of H2O and CO2 H2O symmetric O-H stretch asymmetric O-H stretch symmetric O-H bend CO2 (c) (a) (b) Symmetric mode (a) produces no dipole moment and no absorption of IR radiation by CO2 . Asymmetric modes (b) and (c) produce "dipole moment", and are responsible for IR radiation absorption by CO2.
Intermission !!! Quiz: What’s the difference ??? (A) (B) heat water water heat Answer: (A): No convective mixing, stable water (B): Convective mixing, unstable water
Atmospheric boundary layer and its evolution 50 m - 3km • During daytime, solar heating of the earth surface persistent turbulence and convective mixing of the air • well mixed layer in the atmosphere up to few kilometers altitude of the troposphere. • The mixing height or the thickness of ABL depends on the nature of the surface, amount of heat energy and • humidity of a place. • At night, the ground cools off thermals and turbulence cease mixed layer changes into residual layer a • stable boundary layer of cool air is formed near the ground. • Surface layer the lowest part of ABL and actual region of mixing. Figure adapted from Stull,1988
Why do we care about the profile of ABL? • ABL is the area of the atmosphere in which we live, and all of our activities take place there. • It is the region where heat, momentum, water vapor, and other trace substances are exchanged with the Earth’s surface. • It is where nearly all of our weather is produced.
FTIR spectroscopy FTIR is the abbreviation of Fourier transform Infrared radiation. It consists of: (a) Michelson interferometer and (b) computer for Fourier transform. path difference = x1 - x2 measured interferogram movable mirror X2 beam-splitter fixed mirror computed spectrum source X1 interferogram detector note: = 1/ (cm-1) Fourier transform spectrum R() interferogram, ID
Calibration of FTIR spectrometer hot BB window mirror Circulation water in Circulation Water Out Brass Cone cold BB 5 cm Thermistor probe Black Paint FTIR spectrometer 30cm • b = (V1-V2)/(B1-B2) • a = [ V1(B1-B2) - B1(V1-V2) ]/(B1-B2) • Finally the calibrated target radiance is given by • R() = [ (B1 - B2) V+ V1B2 - V2B1 ] / (V1 - V2) • Assumed linear model for spectral response: • V() = a() + b () R() • ▪ V(): detector voltage • ▪ R(): target radiance • ▪ R() = B() for perfect black body at temperature T • ▪ a() and b() are calibration factors. • With the measurements of cold and hot black • bodies, we obtain a and b as follows:
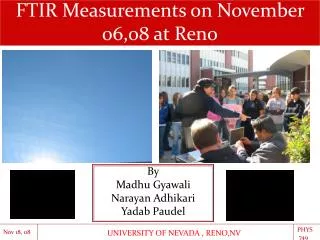
Measurement of downwelling IR radiance with FTIR at UNR Cloudy sky, 01 Apr., 2010 Clear sky, 06 Apr., 2010 • Strong IR absorption bands : • H2O vapor : < 650 cm-1 & • :1300 cm-1 2000 cm-1 • CO2 : near 667 cm-1 ( or 15 m) • The atmosphere seems to be opaque at these spectral • regions. • Atmospheric “dirty’ window region for IR radiation • 800 – 1300 cm-1 • The atmosphere is more transparent at this region and • FTIR records emission from the higher atmosphere. • O3 absorption band: centered at 1042 cm-1 (9.6 m ). • This and H2O vapor absorption lines make the • window region dirty. • April 06 shows less radiance than April 01. Significant • difference is observed at the window region. • Note: 1cm-1 = 0.04 m and 1m = 25 cm-1.
contd… Brightness temperature (Tb): For = 1, Tb physical temperature (T) For 1, Tb T. • The temperatures at strong CO2 and H2O absorption spectral regions refer to that of lowest levels of the atmosphere (285 K ). • April 01 is slightly warmer than April • 06. • The funny ‘cold’ spike at the center • of the ozone absorption band • corresponds to an unique region of • relative transparency.
Retrieval methodology: overview Model radiance Observed radiance We minimize the difference: by adjusting the values of T(z) and RH(z) for Retrieved temperature and humidity profile Altitude (m) temperature (K) mixing ratio (g/kg)
Measurement of model radiance Thermal IR radiative transfer (non- scattering atmosphere) TOA Ttop 0 Radiant intensity at reaching the sensor at ground is: where : Planck’s emission function (transmittance at ) K: absorption coefficient of an absorbing gas e.g. water vapor ( obtain from HITRAN database) q(p): mixing ratio of water vapor Tm pm T2 p2 T1 p1 Ts surface ps • Finally, we solve eqn. (1) using retrieval code with guess T(p) and q(p) to compute .
Retrieved temperature structure* FTIR measurement at Lamont, Oklahoma 12 Sept. 1996 2000 1750 287 1500 289 1250 Temperature in Kelvin 1000 291 750 293 500 295 250 297 299 • Both cross sections show the • rapid vertical temperature • decrease of the atmosphere at • around 0600 UTC from 0 to • 1500 km. • A cold front passes through the • site on that day. • Some differences between the • panels are caused by the • difference in frequencies of • FTIR and weather balloon • soundings. 0 0 2 4 6 8 10 12 14 16 18 20 22 24 Weather balloon measurement at Lamont , Oklahoma 12 Sept. 1996 Altitude (m) 2000 287 1750 1500 289 1250 1000 291 750 293 500 295 250 297 0 299 0 2 4 6 8 10 12 14 16 18 20 22 23 Time (UTC) Comparison of an FTIR boundary layer temperature retrievals to an interpolated weather balloon temperature-time cross section (weather balloon launches are indicated by the long dashed lines). *Adapted from Smith L. William, 1999, JAOT
Conclusions • FTIR ABL profiles provide data for numerical forecast models. • Since the normal frequency of weather balloon launches is 12h, the FTIR provides much better temporal resolution of the ABL features than the weather balloon does. • FTIR measurements allow for retrieval of the temperature and water vapor vertical profiles during rapid air mass transitions. • FTIR sounding radiances reinforcing with satellite sounding radiances can yield entire tropospheric vertical profiles of temperature and water vapor.
Future work • Use of FTIR measurements in our own retrieval code to obtain the temperature and humidity structure of the atmospheric boundary layer (ABL). • With FTIR measurement, we can frequently update the primary meteorological parameters of Reno which will be helpful to: - monitor the air quality by estimating potential air pollution dilution in Reno. - predict daily weather of Reno. - study the diurnal and seasonal variation of air quality in Reno.
Appreciation Dr. W. Patrick Arnott Associate Professor Director, Undergraduate Atmospheric Sciences Program UNR Madhu Gyawali, Graduate Student, UNR Michael Weller Graduate Student, UNR
References • Smith, W.L., W.F. Feltz, R.O. Knuteson, H.E. Revercomb, H.B. Howell, and H.M. Woolf, 1998: The retrieval of planetary boundary layer structure using ground-based infrared spectral radiance measurements. J.Atmos. Oceanic Technol., 16 • W.F. Feltz, W.L. Smith, R.O. Knuteson, H.E. Revercomb, H.M. Woolf, and H.B. Howell, 1995: Meteorological applications of the Atmospheric Emitted Radiance Interferometer(AERI). J. APP., Meteor., 37 • Smith, W.L., 1970: Iterative solution of the radiative transfer equation for the temperature and absorbing gas profile of an atmosphere. App. Opt., 9, 9. • W. F. Feltz, W. l. Smith, R.O. Knuteson, and B. Howell, 1996: AERI temperature and water vapor retrievals: Improvements using an integrated profile retrieval approach. Session Papers. • Liou K.N., 2002: An Introduction to atmospheric Radiation Second Edition. Academic press. • Wallace J.M., Hobbs P.V.,: Atmospheric Science An Introductory survey second edition. Academic Press. • Han Y., J. A. Shaw, J. H. Churnside, P.D. Brown and S.A. Clough,1997: Infrared spectral radiance measurements in the tropical Pacific atmosphere. • Petty W. Grant: A first course in Atmospheric Radiation Second Edition. Sundog Publishing.
Thank You! My Home Village and my High School