Download
1 / 17
180 likes | 282 Vues
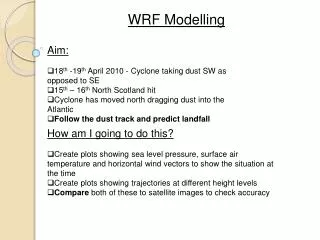
Explore new verification techniques for assessing rainfall forecasts in NWP models, focusing on diurnal and propagating aspects, including case studies and extended period evaluations. Improve forecast accuracy and provide insightful feedback to developers and users.

E N D
WRF Verification: Chris Davis NCAR (MMM/RAP) New Methods of Evaluating Rainfall Prediction Collaborators: Dave Ahijevych, Mike Baldwin, Barb Brown, Randy Bullock, Jennifer Mahoney, Kevin Manning, Rebecca Morss, Stan Trier, John Tuttle and Wei Wang
WRF Verification Effort • Case studies • Real-time forecasts • Extended-period case studies • Idealized tests of physical parameterizations • Application of new verification methods
Objectives of New Verification Methods • Reduce dimension of verification problem • Make statistics sensitive to error magnitude • Address and target fundamental processes in models • Provide useful feedback to developers and users • Make automated, yet insightful
Daily Cycle of Rainfall (Echo Frequency) 00 Z “Standard”: 102-110 W “Out of phase”:96-102 W Semidiurnal: 92-96 W Mainly Diurnal: 78-92 W 12 Z 00 Z 110 W 102 W 94 W 86 W 78 W
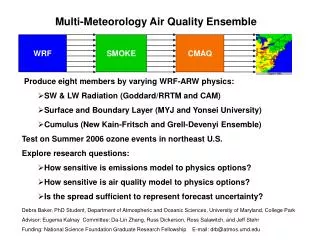
Diurnal Rainfall Signatures in NWP models Models: • NCEP Eta: hydrostatic, 22-km, 50 levels, eta (step-mountain) coordinate, two-phase ice, Betts-Miller-Janjic cumulus scheme, MYJ boundary layer, OSU land surface model. Two 48-h forecasts per day. • Weather Research and Forecast Model (WRF): nonhydrostatic, 22-km, 28 levels, height-coordinate, two-phase ice, Betts-Miller-Janjic cumulus scheme, MRF boundary layer, slab surface model. Two 48-h forecasts per day. Method: • Compile 3-hourly precipitation forecasts and analyses for July and August 2001. • Analyze all data to common 10-km grid. • Average precipitation from 30 N – 45 N. • Assume “echo” is averaged 3-h rainfall > 0.1 mm.
Stage IV GMT Diurnal Hovmoller Diagrams: 22-km Eta and WRF 00Z Eta 12-36 h 00Z WRF 12-36 h GMT 12Z Eta 12-36 h 12Z WRF 12-36 h GMT ? Longitude Longitude
An Example of Rainfall Prediction Errors Left: 24-42 h forecasts from WRF model Right: Observations from NCEP analysis Gray: 40% echo freq. from 4-year climatology 110 W 78 W
Time-Latitude Diagrams Stage IV WRF August, 2001 Latitude Latitude 30 N 45 N 30 N 45 N
O F O F F O O F What does CSI=0 (or ETS=0) mean to you? In all cases: POD=0, FAR=1, CSI=0
A Proposed Approach(based somewhat on Ebert and McBride) • Define precipitation/convective objects and shapes • Diagnose errors in location, shape, orientation, size, timing, etc. • Characterize basic attributes of precipitation/convection within objects: intensity, density, etc. • In parallel: Investigate user issues
Defining objects Original WRF forecasts from 10-km grid Convolved Thresholded
Summary and Issues Rainfall Statistics • Large NWP-model errors (WRF, Eta) in the diurnal and propagating aspects of warm-season rainfall • Better representation of latitude of rainfall than longitude • Do we need cloud-resolving grids to capture properly?
Summary and Issues (continued) Rain-area Verification • Method yields errors on location (x,y,t), size and orientation of rain areas and allows partitioning of areas with similar attributes • PDFs of rainfall intensity are evaluated: appropriate for application to inherently stochastic processes • How will this improve models more readily than “traditional” methods (ETS, bias)? • Intensity PDF contains more information than bias: strongly tied to cumulus and/or cloud physics schemes • Systematic shape errors could indicate problems in identifying modes of organized convection • Systematic timing/location errors could point to errors in treating diurnal and orographic effects