Diabetes in School
780 likes | 1.16k Vues
Diabetes in School. Diane Spokus Doctoral Candidate Health Educator Southcentral PA Area Health Education Center (AHEC). AHEC MISSION. The mission of the Pennsylvania AHEC Program is to help communities meet their primary health care needs.

Diabetes in School
E N D
Presentation Transcript
Diabetes in School Diane Spokus Doctoral Candidate Health Educator Southcentral PA Area Health Education Center (AHEC)
AHEC MISSION The mission of the Pennsylvania AHEC Program is to help communities meet their primary health care needs
by creating a statewide infrastructure bridging community and academic resources to:
NEEDS LOCAL SOLUTIONS • Each underserved community & individual has a different set of needs that must be identified and addressed.
Recruit and retain primary care providers in underserved communities.
Overview • Current statistics on childhood overweight • Contributing factors and behaviors • Health Impact • Prevention strategies • Resources
Thought Provoking Quote “Today’s children’s lives may be shorter than their parents.” (Food Fight, Brownell and Horgen, 2003)
Background • Overweight Chronic condition that develops when energy intake exceeds energy expenditure, resulting in excessive body weight
Epidemic • An estimated 9 million young people are overweight • The percentage of children/adolescents that are overweight has doubled since the 1970’s • Obesity is now the most prevalent nutritional disease of children and adolescents in the United States
Epidemic • 1 in 3 children born in the year 2000 will develop Type II Diabetes (based on current trends) • 27% of children age 5-10 have 1 or more heart disease risk factors
Why Worry About Pediatric Overweight? • Probability of overweight children being obese as an adults. • 20% at 4 years of age • 50% at 6 years of age • 80% as an adolescent • Pediatric overweight impacts on adult health • 2 fold increase in mortality as an adult in obese vs. non-obese adolescents
Percentage of US Children and Adolescents Who Were Overweight
Percentage of Overweight Children & Youth Who Become Obese Adults
Contributing Factors • Physical Activity • Diet • Genetics • Environmental (time, convenience, technology & community design) • Socioeconomic • Behavioral Complex interacting forces OBESITY
Contributing Factors- Physical Activity • Children spend approximately 75% of their waking hours being inactive • 31% do not achieve recommended levels of physical activity • Girls are less likely than boys to engage in vigorous activity YRBS 2001, CDC
2% of children (2 to 19 years) meet the five main recommendations for a healthy diet-Food GuidePyramid 75% if children consume more saturated fat than is recommended-Dietary Guidelines for Americans National Alliance for Nutrition and Activity, 2003 45 % of children eat no fruit. 20% eat less than one serving of vegetables. (7 servings a day are recommended for this age group) Contributing Factors- Diet
Contributing Factors- Diet • Children’s calorie intake increased by approximately 80 to 230 extra calories per day ( between 1989 and 1996, depending on the child’s age and activity level) • The number of calories children consume from snacks increased by 30% between 1977 and 1996 • A child’s chance of becoming overweight increased by 60% with each additional can of soda or juice drink National Alliance for Nutrition and Activity, 2003
Number of People with Diabetes • United States 13 Million • Pennsylvania 660,000 People with diabetes that do not know it: • United States 5.2 Million
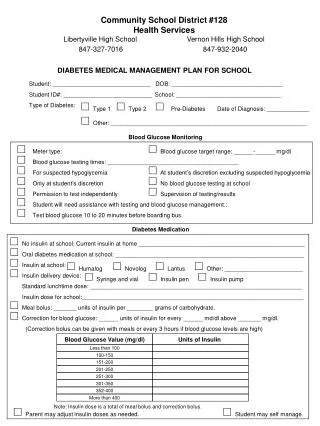
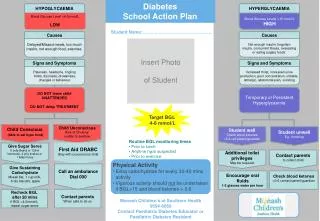
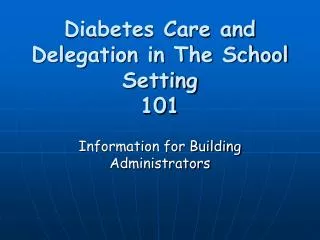
Learning Objectives • Diabetes Basics • Develop a Plan of Treatment • Effective Diabetes Management • Hypoglycemia • Hyperglycemia • Blood Glucose Monitoring • Emergency Action Plan
The Child with Diabetes is a Shared Responsibility in School CHILD
Schools/Teachers Responsibility and Liability • “A school district must provide a child with a handicapping condition, including children with diabetes, all services necessary to assist the student to benefit from his/her school program.” • (Act 15, Section 504, Rehabilitation Act of 1973)
Individual Education Plan (IEP)or Individual Health Plan (IHP) • Written plan of the child’s specific health needs • Every child with diabetes should have one • Implemented collaboratively with the school nurse, student, parents, and school personnel • Emergency treatment and contact information
What is Diabetes? • It is a serious, chronic disease in which you have a highblood sugar level due to a lack of insulin • Insulin is needed to take the glucose(sugar) out of the bloodstream and move it into the body’s cells to use for energy
Diabetes Basics • Diabetes is a metabolic disorder that impairs the body’s ability to use food properly • When we eat food it breaks down into sugar • Sugar is needed for energy • Sugar gets into the body’s cells with the help of insulin • Insulin is a hormone released by the pancreas • When sugar can’t get into the cells it builds up in the bloodstream causing a high blood sugar level • This is Diabetes
Blood Glucose Levels • The amount of glucose in the blood. The recommended blood glucose levels for most people with diabetes are from about 80 to 120 before a meal, 180 or less after a meal, and between 100 and 140 at bedtime.
Types of Diabetes • Type 1Type 2 • No InsulinNot enough insulin produced producedBody unable to use insulin produced
Type 1 Causes: Heredity Autoimmune disorder Environmental Population: People under age 30 10% population Type 2 Causes: Heredity (Family) Obesity Physically inactive Dietary Intake Advancing Age Ethnicity (Race) Population: Adults Children 90% population Risk Factors
Risk Factors • Certain racial or ethnic groups, such as African Americans, Hispanic/Latino Americans, American Indians, and some Asian Americans and Pacific Islander Americans.
Contributing Factors- Socioeconomic • National Growth and Health Study • Concluded parental socioeconomic status is associated inversely with childhood overweight in white children but not African American and Hispanic
Contributing Factors- Behavioral • Family meal patterns and food choices • Food availability • Portion sizes • School food service and vending
Health Impact • Cardiovascular • Endocrine system • Pulmonary • Orthopedic • Gastrointestinal/Hepatic • Mental Health
Cardiovascular High blood pressure Elevated cholesterol levels Elevated triglyceride level Endocrine Type 2 diabetes Menstrual irregularity Early onset of menstruation Insulin problems Health Impact
Type 1 Frequent urination Very thirsty/hunger Feeling very tired Blurred vision Unexplained weight loss Type 2 Frequent urination Very hungry/thirsty Feeling very tired Blurred vision Slow healing cuts Frequent infections No symptoms at all Signs and Symptoms of Diabetes
Type 1 Absolute insulin deficiency Treatment Insulin Shots Meal Planning/Health Diet Monitoring Glucose Exercise Type 2 Produce insulin Insulin Resistance Treatment Meal Planning/Health Diet Exercise Weight Loss Monitoring Glucose Medication (pills, insulin, or both, if necessary) Diabetes
What Happens When You Eat • Cells in your body need sugars and starches for energy to do their job • Food you eat is turned into sugar and starches by the stomach • Sugars and starches are carried in the bloodstream to the cells • The pancreas makes more insulin – the key- that opens the doors of the cells so the sugar goes into the cell
What Happens When You Eat = Sugar = Insulin
If you have Insulin, you have the Key = Sugar = Insulin Not Having Diabetes
Not having Insulin - you lack the Key to open the door to cell wall Having Diabetes
Complications of Diabetes • Eye Damage • blindness • Increased risk for heart attack and strokes • Kidney damage • Nerve damage • Foot ulcers/impaired wound healing • amputations
Lifestyle Changes • Healthy Diet • Physical Activity • Stop Smoking • Reduce Stress
Type 1Effective Diabetes Management • Insulin(1-4 injections daily) • Blood glucose monitoring (3-4 times daily) • Meal Planning (carbohydrate counting) • Exercise • Ketone Testing (BS>240 or illness) • Lab work- keep within target range
Type 2 Effective Diabetes Management • Meal Planning (decrease fat/cholesterol) • Increase activity (physical exercise) • Glucose monitoring • Medication (oral or insulin) • Lab work- keep within target range
Hypoglycemia(Low Blood Sugar) • Teachers Must Know • Know the symptoms common to your student • Times most likely to occur • (before lunch, during and after exercise) • How to treat • Response time after treatment • (15 minutes) • When do parents wish to be notified?
Causes of Hypoglycemia(Low Blood Sugar level) Causes: • Skipped meals/snacks • Extra Exercise (burns more sugar) • Incorrect dose of insulin
Hypoglycemia(Low Blood Sugar) • Symptoms • Shakiness Sweating • Anxious Irritable/crying • Headache Fast Heartbeat • Hunger Dizziness • Impaired vision (Blurry) • Decreased concentration • Difficulty following directions • Weak and tired