Building a Commodity Based Freight Model in Cargo : Los Angeles Example
330 likes | 444 Vues
This study demonstrates the development of a comprehensive commodity-based freight model in Los Angeles, addressing the significant growth in goods movement by integrating multiple transportation elements. The model incorporates detailed socioeconomic data, commodity flow data, and trip distribution surveys to improve the efficiency of freight movement. Objectives include analyzing long-haul and short-haul freight dynamics, service truck movements, and emerging trends in labor productivity, imports, and exports. This integrated approach aims to facilitate better decision-making in freight logistics and transportation planning.

Building a Commodity Based Freight Model in Cargo : Los Angeles Example
E N D
Presentation Transcript
Building a Commodity Based Freight Model in Cargo : Los Angeles Example Vamsee Modugula vmodugula@citilabs.com
Citilabs– the Company Develops software for the modeling of transportation systems Offices Florida USA Paris, Milan Europe Beijing, Mumbai Asia 3000 cities on 6 continents in more than 70 countries
North America: • Los Angeles, Houston, Miami, Orlando, Washington. Atlanta, San Francisco, Minneapolis, St. Louis, Tampa, Baltimore, Pittsburgh, Cincinnati, Sacramento • Europe: • Dublin, London, Manchester, Glasgow, Liverpool, Oslo, Paris, Lyon, Nice, Strasbourg, Valencia, Seville, Milan, Venice • Asia-Pacific: • Taipei, Melbourne, Adelaide, Perth, Brisbane, Seoul, Beijing, Bangkok, Hong Kong, Singapore, Kuala Lumpur, Manila, Jakarta, Delhi • Major engineering firms: • AECOM, PB, Jacobs, Wilbur Smith, URS, PBSJ, Parsons Who Uses Our Products
Educational Institutions: • IITs, NITs, SPA, Engineering Colleges • Research: • CRRI, ISRO, CSTEP • Government • DMRC, Dimts, MOUD, UMTC, PMC, RITES • Major engineering firms: • AECOM, PB, Jacobs, Wilbur Smith, Systra MVA, GMR, L&T Ramboll, Halcrow, Feedback Ventures, Mott MacDonald, Who Uses Our Products
Comprehensive and Integrated Cube6 The only system that covers all facets of transportation modeling • people • goods • land use • region-wide traffic simulation • multi-modal microsimulation Why Cube is the Best Transportation Modeling System
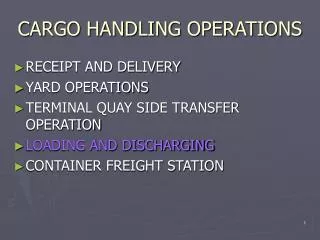
Background • Significant growth in goods movement in the Los Angeles region required improved models to evaluate impacts • Models needed to address different potential improvements • Higher capacity intermodal rail terminals • Truck-only lanes • Extended working hours at the ports • Short-haul shuttles from ports to inland freight facilities
Objectives • Components of the freight model should include • Long-haul freight from commodity flows • Short-haul freight from socioeconomic data in the region and warehouse and distribution centers • Service truck movements • Recognize trends in labor productivity, imports, and exports • Integrate with passenger models
Data Requirements • Detailed Socio-economic data • Reliable Commodity Flow Data • Origin-Destination Surveys to calibrate Trip Distribution • Port Data • Data on TLNs (Intermodal Terminals, distribution Centers, Warehouses) • Truck Classification Counts
Study Area • Within 5 county SCAG region – zip codes • Remainder of California – counties • Remainder of USA – states • 4 external zones; 2 each for Canada and Mexico
Truck Time Functions • LTL Time = Time+40 hrs for loading / unloading • TL Times – Drive 11 hrs between rest periods of 10 hrs
Model Descriptions – Tonnage Generation • Commodities were grouped into 14 categories • Productions based on tonnage rate per employee • Consumptions based on input-output matrix • Port trips added from the Port’s models • Trends in production efficiencies, imports and exports
Wholesale Trade 3% Agriculture 8% Cement and Concrete Manufacturing 11% Petroleum 8% Paper and Wood Products Manufacturing 4% Chemical Manufacturing 5% Other Transportation 9% Equipment Manufacturing 3% Nonmetallic Minerals 17% Food Manufacturing 11% Manufacturing 5% Motor Freight Transportation 11% Metals Manufacturing 5% Mining and Fuels 0% Outbound Tonnage Produced by Commodity Group
Model Descriptions – Tonnage Distribution • Trips split into short-haul and Long Haul • All short-haul trips are assumed to be truck trips • Short trip distribution based on a gravity model • Long trips are distributed using a joint distribution and mode choice model.
Average Trip Length (in Miles) 80 ITMS Short-Haul Model Short-Haul 70 60 50 40 30 20 10 0 Agriculture Chemical Manufacturing Food Manufacturing Other Transportation Petroleum Metals Manufacturing Motor Freight Transportation Cement and Concrete Manufacturing Equipment Manufacturing Manufacturing Mining and Fuels Nonmetallic Minerals Paper and Wood Products Manufacturing Wholesale Trade Commodity Group Trip Distribution Validation for Short-Haul Trips
Model Descriptions – Mode Choice / Service • Estimates Truck and Rail Trips • Based on a multinomial logit model • Three independent variables, time, distance and highway generalized cost • Applied for 3 distance classes • <500, 500-1500 ; >1500 miles • Service Model • Estimates safety, utility, public / personal vehicles
Model Descriptions – Transport Logistics Node Model • Estimates direct and non-direct trips • Includes intermodal terminals, warehouses, distribution centers etc. • Model Outputs are • Direct flows from origin to destination • Flows from origin to the TLN • Flows from the TLN to destination
Vehicle Model • Converts tons to trucks • Parameters to influence empty trucks • Standard Vehicle Model to generate direct O-D flows • Touring vehicle model that simulates multi-point pick-up and drop off
Touring Vehicle Model • Performed on TLN’s and user-specified zones
2030 Model – Tonnage Generation Change in Labor Productivity
2030 Model – Tonnage Generation Change in Imports and Exports
Summary • Developed and tested for one of the most complex freight transportation system in the US • Multimodal tool useful for freight investment decisions • TLN and service models provide accurate accounting of truck trips • Use of changes in labor productivity and trends • Model can evaluate a wider range of alternatives