Download

1 / 33
330 likes | 427 Vues
Access state assessment policies, participation data, custom report creation, and more on the interactive NCEO Data Viewer website. Generate comprehensive reports on accommodations and participation with ease. Explore state summaries and comprehensive glossary.

E N D
Introduction to the NCEO Data Viewer National Center on Educational Outcomes Communities of Practice Teleconference June 5, 2007
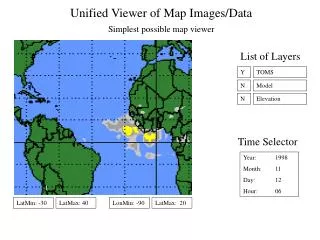
Interactive data website Available online at http://data.nceo.info/ Contains information on: State policies on assessment participation and accommodations State Annual performance report data Users can create customizable reports (tabular charts and color-coded maps) based on chosen criteria Background about the Data Viewer
Choose a category for the report you wish to create, such as Participation Reports (2004-2005). Under State(s) select a state or group of states (e.g., All Regular States). From the list below the popdown menu, select any criteria you wish to view with the check boxes. Click the Run Report button. Selecting 1 or 2 criteria will provide a US Map in addition to a data table. If you do not select any criteria from the provided list, no data will be provided and you will be asked to return to the page (hit your browser's Back button) to select data options. Click the PDF button to receive a PDF version of the report. To run a new report, click the Back button and click Reset. (It is recommended to Reset before starting a new report.) Participation and Accommodations Report Designer:
Includes information such as: How students participate Additional testing options Criteria that can/cannot be used to guide accommodations decision-making How states make decisions about accommodations that aren’t on an approved list Report Designer: Participation
Includes documents reviewed for inclusion in the data viewer All questions about participation included in the data viewer All questions about accommodations included in the data viewer Excerpted information from state policies (note: not available for every question) Participation and Accommodations State Summary Reports
Reports can be generated based on selected states and accommodations category (e.g., presentation, equipment, response, setting, and timing) Reports can be created to illustrate policies in one state, to compare two states, or to see policies in all states Report Designer: Accommodations
Participation: Click on the test year of your choice, for example, Participation in State Assessments (2003-2004). Choose a Subject (e.g., Reading) and a Grade (e.g., Any High School [9-12]) from the pop down menus. Under Map Divisions either use the Default (states will display in 5 colors reporting 5 equal division of report values) or Custom build your divisions and select your own incremental analysis, such as Display values in increments of 2% starting at 90%. Choose a report to view by selecting any of the radio buttons. Click the button, Run Report. Click the PDF button to receive a PDF version of the report. To run a new report, click the Back button. To clear all filters, click Reset button. (It is recommended to Reset before starting a new report.) Annual PerformanceReports (APR) Report Designer:
Glossary of terms Link to online publications by NCEO Look for an online tutorial for the data viewer—coming soon to the NCEO website! Other Features