Download
1 / 36
360 likes | 678 Vues
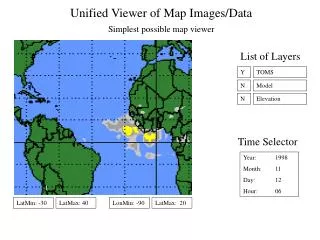
Unified Viewer of Map Images/Data Simplest possible map viewer. List of Layers. Y. TOMS. N. Model. N. Elevation. Time Selector. Year: 1998 Month: 11 Day: 12 Hour: 06. LatMin: -30. LatMax: 40. LonMin: -90. LatMax: 20.

E N D
Unified Viewer of Map Images/Data Simplest possible map viewer List of Layers Y TOMS N Model N Elevation Time Selector Year: 1998 Month: 11 Day: 12 Hour: 06 LatMin: -30 LatMax: 40 LonMin: -90 LatMax: 20
Live Demo:Distributed ‘Voyager’http://capita.wustl.edu/view3/DVoyDemo1.aspx • Browsing by space, time and parameter dimension (parameters now ‘hard wired’) • Data selection from distributed servers • Data overlay in time and map views • ‘Clickable’ data map and time views for browsing.
Semi-Static Views (slices) through XYZT Data Space Vertical Profile:XYT fixed XY MAP: Z,T fixed XZ CrossSect: Y,T fixed • Possible Cross-sections through the 4 D Dataspace Time Chart: X,Y,Z fixed Vertical Profile Trend: X,Y fixed
XY MAP: Z,T fixed Vertical Profile Trend: X,Y fixed Vertical Profile:XYT fixed Vertical Cross sect: YT fixed Vertical Cross sect: XT fixed Time Chart: X,Y,Z fixed Semi-Static Views (slices) through XYZT Data Space • Possible Cross-sections through the 4 D Data space . Data Point:. - data point..Temperature (xi, yi, zi, ti) - image Temperature (xrange , yrange, zrange, trange)
Dynamic Visualization of XYZT Data Space • Animated 3D Maps
Fast Analysis of Shared Multidimensional Information (FASMI)(Nigel, P. “The OLAP Report”) An OLAP system is characterized as: being Fast – The system is designed to deliver relevant data to users quickly and efficiently; suitable for ‘real-time’ analysis facilitating Analysis – The capability to have users extract not only “raw” data but data that they “calculate” on the fly. being Shared – The data and its access are distributed. being Multidimensional – The key feature. The system provides a multidimensional view of the data. exchanging Information – The ability to disseminate large quantities of various forms of data and information.
4 D Geo-Environmental Data Cube (X, Y, Z, T) Environmental data represent measurements in the physical world which has space (X, Y, Z) and time (T) as its dimensions. The specific inherent dimensions for geo-environmental data are: Longitude X, Latitude Y, Elevation Z and DateTime T. The needs for finding, sharing and integration of geo-environmental data requires that data are ‘coded’ in this 4D data space – at the minimum. Additional for
AHA! • Each dataset dimension needs a controller • A 4D dataset needs 4 controllers • So, attaching dimensional controllers to the xD dataset is a must • The controller for a dimension can be part of a data display of that dimension • LOC controller can be on top of a map view • Time controller on time view • For some datasets, the controller is not in the granule viewer • The 1D TOMS dataset depends on time only -> the controller is a time selector • But, the TOMS image viewer is a map (which is not a selector) • For each dataset dimension, we need to identify in the catalog a • controller class for selection as well as compatible • viewer class for the display of data granules. • Actually this is simpler: • Each dataset has a number of views!! • Each view has a AccessInstructions and Renderinstructions This should allow us to connect controllers and viewers to the dataset based on the controller/viewer classes HUH, was this tough or what!
DVoy: Data Access, Display, Browser, Content • Data Access:Indexed data access framework. (Kari, ‘done’) • Data Display: Spatial, temporal other data rendering (Kari & Jer, not done) • Browser:A specific ‘application’ - linked multidim views (Kari & Jer, not done) • Content: Encoding and registering data sets (Bob & Sean, in progress)
SeaWiFS Reflectance TOMS Absorbing Aerosol Trans-Atlantic Transport of Quebec Smoke July 10: Quebec smoke over Mid-Atlantic July 11: Smoke approaching Europe E. US Spain SeaWiFS Reflectance TOMS Absorbing Aerosol Spain
Web Service Wrapper for TOMS Aerosol Index Fixed Geo-rectangle; Image Trim, daily TOMS Image Metadata Geo-rectangle (65, -180; -65, 180) Image Size (640, 480) Image Margins (40, 40, 30,30) Transparent Colors (0,0,255 ) Image Access Metadata URL template: :ftp://jwocky.gsfc.nasa.gov/pub/eptoms/images/aerosol/YYYYY/eaYYMMDD.gif StartDate, EndDate
Example Data Adapter: Daily TOMS Aerosol Index Map TOMS Image Metadata Geo-rectangle (65, -180; -65, 180) Image Size (640, 480) Image Margins (40, 40, 30,30) Transparent Colors (0,0,255 ) Image Access Metadata StartDate EndDate Incement DataType URL template: :ftp://jwocky.gsfc.nasa.gov/pub/eptoms/images/aerosol/YYYYY/eaYYMMDD.gif
Browsing of Distributed Data from HTTP/FTP Servers Land Reflectance from SeaWiFS Project, NASA GSFC Fire Pixels, Jan 1997, ESA Ionia Project AVHRR Oceanic Aerosol CAPITA, WashU, STL
NRL Forecast Model for Dust, Smoke and SulfateMETAR Surface Haze • Real-time model and surface observations are compared spatially and temporally Smoke Sulfate Dust METAR Haze Time Selector
Current DVoy User Interface Components Catalog: User selects among distributed ‘wrapped’ data Map View: Displays Selected Data Control Panel: Provides user with facilities to customize display NOTE: The data sources are physically located on multiple databases across the country (NASA SQL, CIRA SQL, NOAA SQL …) Terry, the powerplant data could be handled in a similar fashion from the EPA Oracle database
Overlaying PM2.5 Concentration Data PM2.5 data from the IMPROVE and AIRS database at Colorado State provide supporting evidence for smoke impacts Moving the cursor over the PM2.5 locations shows the lat, lon, and concentration for that monitor Live version at: http://capita.wustl.edu/dvoy_services/dvoy.aspx?layxml_file=IdahoFiresWithIMPROVEAug192000.xml
Idaho Fires Example (August 2000) Satellite imagery and satellite fire observations are spatially integrated to show fire sources and smoke transport ASTR Fire Locations SeaWiFS Image showing smoke dispersion DVoy settings can be saved for future use. To view a live display of Idaho fires go to: http://capita.wustl.edu/dvoy_services/dvoy.aspx?layxml_file=IdahoFiresAug192000.xml
Idaho Fires Example (August 2000) Derived aerosol optical depth provides a focused look at smoke dispersion ASTR Fire Locations Processed SeaWiFS image showing aerosol optical depth The SeaWiFS reflectance image is hidden to expose the aerosol optical depth image ‘below’ it
DataView 3 DataView 2 Overlay of multiple Datasets 3 D DataCube DataView 1 • Each DataCube may have 0-n dimensions • Each dimension is assigned a view Null Layer 2 D DataCube Layer 1 Layer 2 • In a view, the number of layers is the number of datasets • If a DataCube does not have a data for a view, a Null Layer is assigned
Quebec Fires, July 6, 2002 SeaWiFS satellite and METAR surface haze shown in the Voyager distributed data browser Satellite data are fetched from NASA GSFC; surface data from NWS/CAPITA servers SeaWiFS, METAR and TOMS Index superimposed
Browsing of Distributed Data from HTTP/FTP Servers Land Reflectance from SeaWiFS Project, NASA GSFC Fire Pixels, Jan 1997, ESA Ionia Project AVHRR Oceanic Aerosol CAPITA, WashU, STL
NRL Forecast Model for Dust, Smoke and SulfateMETAR Surface Haze • Real-time model and surface observations are compared spatially and temporally Smoke Sulfate Dust METAR Haze Time Selector
Current DVoy User Interface Components Catalog: User selects among distributed ‘wrapped’ data Map View: Displays Selected Data Control Panel: Provides user with facilities to customize display NOTE: The data sources are physically located on multiple databases across the country (NASA SQL, CIRA SQL, NOAA SQL …) Terry, the powerplant data could be handled in a similar fashion from the EPA Oracle database
Planned: Multi-Dimensional Browser Map View Variable View Time View WebCamView The views are linked so that making a change in one view, such as selecting a different location in the map view, updates the other views.
NSF-NOAA-EPA/EMAP (NASA)? Project:Real-Time Aerosol Watch System Real-Time Virtual PM Monitoring Dashboard. A web-page for one-stop access to pre-set views of current PM monitoring data including surface PM, satellite, weather and model data. Virtual Workgroup Website. An interactive website which facilitates the active participation of diverse members in the interpretation, discussion, summary and assessment of the on-line PM monitoring data. Air Quality Managers Console. Helps PM managers make decisions during major aerosol events; delivers a subset of the PM data relevant to the AQ managers, including summary reports prepared by the Virtual workgroups.
Origin of Clean (blue) Dirty (red) Air Masses to Vermont Satellite and Surface detection of Aerosol pollution Time series display and selector
State-Aware, Bi-directional Client-Server Interaction With Perl and Client-Side JavaScript. • Ronan Ogerronan@roasp.com • RO IT Systems GmbHMarktgasse 218001 ZurichSwitzerland • Keywords: Serverside SVG Generation; Thin Client; Perl; Client-Server • Developing a scaleable, multi-browser, real-time arcade-style video game as an example of a thin-client state-aware application using Perl,SVG, and JavaScript • The Internet provides near-instantaneous, content-rich communications between geographically distant agents. A key limiting factor on the usefulness of the Internet has until recently been the technological limitations on the type and direction of this data exchange. All transfers involving the HTTP protocol have been limited to half-duplex, unidirectional, stateless serial communications, or TCP-based communications between bandwidth-consuming plug-ins such as Applets, or security-prone, vendor-specific technologies such as ActiveX components. • By combining server-side SVG generation using object-oriented languages such as Perl with client-side XML manipulation with JavaScript, content generators are now able to implement lightweight, bilateral, secure, low-bandwidth communication between the browser and the server. This enables the generation of state-aware, refresh-free web content, and the simultaneous manipulation of web content on multiple browsers or servers from a single browser or server. • The integration of SVG into the Internet browser, along with the browser's support of the interaction between the SVG Document Object Model (DOM) and JavaScript, now provides the necessary foundation for rich, real-time, bi-directional client-server communication. The coming together of SVG, JavaScript, and Perl enable the browser to take its place on the computer desktop as a host for meaningful, graphically intense programs. By keeping the complex components of these programs on the server and limiting the processing complexity at the client to rendering, the SVG-Perl-JavaScript triangle has the potential for throwing into question the dominance of the Operating-System-resident application on the desktop, finally making it possible to build complete thin-client applications with a browser for the presentation layer and Perl on a server to for processing the business logic. • The construction of a thin-client application will be explored through the example of an N-browser, interactive game using the powerful Perl SVG module family and JavaScript client-side event handlers. The exceptional qualities of Perl for SVG and XML Webservice applications will be demonstrated with a scaleable, self-contained, dedicated, platform-independent SVG Webservice application.
Federated Information Systems:Concepts, Terminology and ArchitecturesSusanne Busse, Ralf-Detlef Kutsche, Ulf Leser, Herbert WeberTechnische Universität Berlin, Fachbereich 13 InformatikComputergestützte InformationssystemeCISEinsteinufer 17, D- 10587 BerlinEmail: {sbusse,rkutsche,leser}@cs.tu-berlin.de • Dvoy Services offer a homogeneous, read-only access mechanism to a dynamically changing collection of heterogeneous, autonomous and distributed information sources. • Data access uses a global multidimensional schema consisting of spatial, temporal and parameter dimensions, suitable for data browsing and online analytical processing, OLAP. The limited query capabilities yield slices through the spatio-temporal data cubes. • The main software components of Dvoy are wrappers, which encapsulate sources and remove technical heterogeneity, and mediators, which resolve the logical heterogeneity. • Wrapper classes are available for geo-spatial (incl. satellite) images, SQL servers, text files,etc. The mediator classes are implemented as web services for uniform data access, transformation and portrayal.
DVOY State Maintenance This DVoyState data structure contains the state variables, which drive DVoy during browsing It is created by the DataCatalogWarpping service using the Catalog and Wrapping information User actions on Controllersmodify the DVoyState structure directly but do not execute changes Actions are executed by managers (e.g. ConMan for connections) based on changes in DVoyState DVoyState resides on the client web page, hence it is unique for each Dvoy session The session state can be saved as a web page and can be recreated at load time Workbooks can be created from multiple pages of DVoyState (not yet implemented)
DVOY Interfaces Data Input • Data input Data Output - Browser • The DVOY interface is composed of data viewers and controllers, all displayed on a webpage • The web services and the preparation of the webpage interface is through .NET(Microsoft) • The graphic data display on the webpage uses an SVG plugin (Adobe) • The DVOY controls are linked to the SVG plugin and the .NET through client-side JavaScript Data Output – Web Service • The DVOY outputs are XML formatted datasets suitable for chaining with processing or rendering services
wind direction PM/Bext time series Bext contours back trajectories PM2.5 contours satellite image temperature NAAPS model web cam Real-time PM Monitoring DashboardExample Views – Selected from Dozens of spatial, temporal, height cross-sections