Download
1 / 13
130 likes | 249 Vues
Explore the UM/RSMAS Real-Time Coupled Modeling System's verification of track, intensity, and structure for typhoons during ITOP. Discover the impact of high-resolution models and insights from CATIE diagram.

E N D
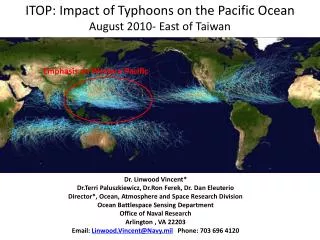
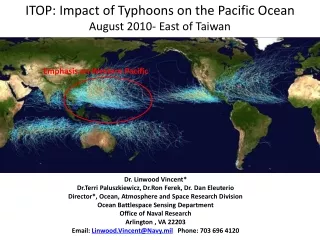
Multi-model Coupled Air-Sea Forecasts of Typhoons during ITOP Brandon Kerns*, Shuyi S. Chen, Chiaying Lee, and FalkoJudt RSMAS/University of Miami *bkerns@rsmas.miami.edu Interdepartmental Hurricane Conference Miami, Florida 28 February – 3 March 2011
Outline • UM/RSMAS Realtime coupled modeling system • Coupled Model Forecast verification • Track and intensity • Combined track & Intensity: Cross-Along Track Intensity Error (CATIE) • Beyond track and intensity: structure (e.g., size, asymmetry, etc.)
U.Miami Real Time Coupled Multi-Model System 12 km 12 km 4 km 4 km 1.3 km 1.3 km *Price et al. (1986)
Atmosphere Ocean Waves
Verification: ITOP Cases *Once per day while storm is in area of interest. A record-breaking Cat-5 super typhoon S-curve S-curve These were CHALENGING cases!
Track Intensity • High-resolution (1.3 km) coupled models (UMCM and CWRF) improve intensity forecast significantly • GFDN and COAMPS-TC have smaller intensity error, but larger track error compared to that of global models
Track and Intensity OPERATIONAL High-res UMCM & CWRF GFDN big track error Megi Megi INTENSITY TRACK GFDN great intensity forecast Megi Megi
Cross/Along Track Intensity Error “CATIE” GFDN CWRF-gfs 24 hr 48 hr 72 hr 96 hr 120hr Along Track Error Along Track Error Cross Track Error Cross Track Error
Cross/Along Track Intensity Error “CATIE” GFDN CWRF-gfs
TC Structure: Size and Asymmetry Comparison of dropsondes and model wind swath. Fanapi Fanapi UMCM-gfs CWRF-gfs
Verification of Structure: Size Fanapi 200 UMCM-gfs Radius (nm) UMCM-gfs 100 BEST 9/16 9/17 9/18 9/19 9/20 9/21 • Hurricane wind radii are near the best track estimates, but not gale radii. • Details of the wind field can affect ocean response.
Verification: (Cold Wake) UMCM-gfs CWRF-gfs Satellite SST SATSST
Summary • High-resolution coupled atmosphere-ocean-wave model forecasts were made in real-time in support of the ITOP field campaign. • Track and intensity errors of the high-res coupled models for the 3 typhoons compare favorably with the operational models and the official JTWC forecast. • The “CATIE” diagram is used to visualize/verify track and intensity errors concurrently. • ITOP provides a unique, coupled data set for evaluation and verification of the high-res coupled model forecasts of TC structure, air-sea fluxes, and upper ocean properties.