Download
1 / 25
260 likes | 515 Vues
Samples from Working with PowerPoint Graphics, Diagrams and Charts. Common Types of Diagrams. Venn Areas of overlap between elements Radial Relationship of core element Parts to a whole Hierarchy Relationship of main ideas to sub-ideas Cycle Shows process with a continuous cycle

E N D
Samples from Working with PowerPoint Graphics, Diagrams and Charts Victoria Ricciardiello
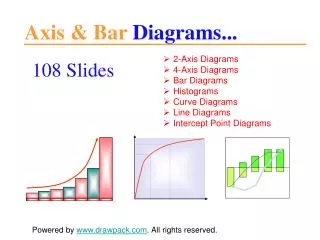
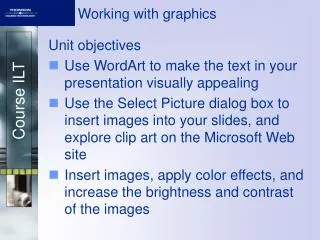
Common Types of Diagrams • Venn • Areas of overlap between elements • Radial • Relationship of core element • Parts to a whole • Hierarchy • Relationship of main ideas to sub-ideas • Cycle • Shows process with a continuous cycle • Pyramid • Foundation based relationships • Target • Shows steps towards a goal Victoria Ricciardiello
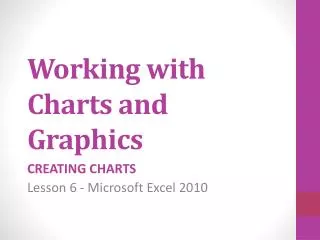
Tables, Charts and Illustrations • Tables • Summarize information • Organization chart • Shows hierarchical relationships • Illustrations • Clarify information Victoria Ricciardiello
Creating a SmartArt Graphic • Click on the Insert Tab and then click on the SmartArt Icon • Select the Desired Graphic • Enter your text • Format as desired Victoria Ricciardiello
Time Moves On Victoria Ricciardiello
How Do I:Add a SmartArt Style to the SmartArt Graphic • Insert a SmartArt graphic to your slide • Click on the outer border of the graphic • Click on the Design Tab from the SmartArt Tools Tab • Select the desired SmartArt Style • The SmartArt Style Brick Scene was applied • The colors for the three small circles were changed as desired after adding the SmartArt style SmartArt Style Brick Scene was selected From SmartArt Tools, select Design Victoria Ricciardiello
Converting Bulleted Slide Text to a SmartArt Graphic • You have bulleted text and you want to convert that text to a graphic • Click the placeholder that contains the text you want to convert • Click on the Home tab and then in the Paragraph group, click on the Convert to SmartArt graphic icon • When the gallery displays, click on the desired graphic • The gallery contains layouts for SmartArt graphics that work best with bulleted lists • To view additional layouts, click More Smart Art Graphics Victoria Ricciardiello
Examples of Bulleted Text Converted to SmartArt • Days of the week • Monday • Tuesday • Wednesday • Thursday • Friday Victoria Ricciardiello
Adding a Photograph as a Slide Background • Right click the mouse in a blank area of the slide. • From the drop down list, click on Format Background • Click on Picture or Texture Fill • Click on Insert From File button • Select the location and the photograph • I added some transparency to this photo • If you only want to insert the photograph to one slide, click on the close button • Do not click on Apply to All unless you want it to be the background for all your slides Victoria Ricciardiello
Inserting a Photograph to a Slide • Click on the Insert Tab • Click on the Picture Icon • Select the picture location and select the picture • Resize the picture • Can add a frame or border if desired • Click on Format then select a picture styles Victoria Ricciardiello
Creating and Formatting a Table Pull Down • Click on Insert table and select the number of rows and columns • Click on the middle sizing handles and pull the table down • Format the table as desired by using borders and fills • Additional rows and columns can be added by clicking on the Layout tab and making appropriate selections Victoria Ricciardiello
My First Beveled Table Victoria Ricciardiello
Creating a Picture Collage Victoria Ricciardiello
Modifying a Picture These pictures were modified by using the Set Transparent Color icon A border was added and the picture was reshaped Victoria Ricciardiello
This Picture was Re-colored This picture was inserted from file and not as part of the Photo Album Victoria Ricciardiello
Using the Cropping Tool • Click on the image and then click on the Format Tab • From the Format tab, click on the cropping tool and crop the image. You will see dark cropping lines. Just push on them to crop the image. Once the image has been cropped, the lines will disappear and be replaced with round sizing handles. Victoria Ricciardiello
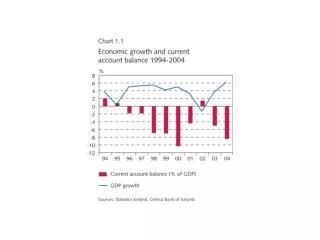
Pie chart was created in Excel and copied and pasted to PowerPoint Victoria Ricciardiello
Access Database Query Was Copied and Pasted to PowerPoint The image was cropped and a Picture Style was applied Victoria Ricciardiello
Characteristics of PrimeNumbers Even Numbers Prime Numbers 4 7 8 2 5 10 11 6 3 9 Multiples of 3 Venn Diagram Victoria Ricciardiello
Comparing Owls From Mrs. Frisby and The Rats of NIMH and Poppy Venn Diagram Hunt at night Bully Eat mice Helpful Knowledgeable Coward Poppy Mrs. Frisby Victoria Ricciardiello
Ungroup an Image Once and You Can Change Colors Victoria Ricciardiello
Ungroup Twice and See the Different Components Victoria Ricciardiello
Ungrouped Objects with Entrance and Exit Animation Good By Victoria Ricciardiello