
Uploaded by
zaide
1 SLIDES
195 VUES
10LIKES
Northeast
DESCRIPTION
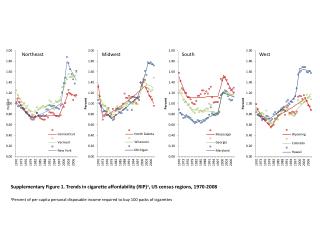
Northeast. Midwest. South. Supplementary Figure 1 . Trends in cigarette affordability (RIP) a , US census regions, 1970-2008 a Percent of per capita personal disposable income required to buy 100 packs of cigarettes.
Download
1 / 1
Télécharger la présentation 
Northeast
An Image/Link below is provided (as is) to download presentation
Download Policy: Content on the Website is provided to you AS IS for your information and personal use and may not be sold / licensed / shared on other websites without getting consent from its author.
Content is provided to you AS IS for your information and personal use only.
Download presentation by click this link.
While downloading, if for some reason you are not able to download a presentation, the publisher may have deleted the file from their server.
During download, if you can't get a presentation, the file might be deleted by the publisher.
E N D
Presentation Transcript
Northeast Midwest South Supplementary Figure 1. Trends in cigarette affordability (RIP)a, US census regions, 1970-2008 aPercentof per capita personal disposable income required to buy 100 packs of cigarettes


More Related