Download
1 / 23
240 likes | 542 Vues
Poverty Among Massachusetts Asian Americans. Mining the U.S. Census and a couple of other things. What’s “Asian American” in the Census?”. Using the Low Estimate of the Number of Asian Americans 1990: Asian Pacific Islander vs. 2000: Asian

E N D
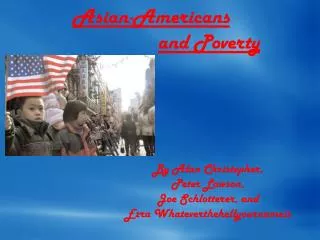
Poverty Among Massachusetts Asian Americans Mining the U.S. Census and a couple of other things
What’s “Asian American” in the Census?” • Using the Low Estimate of the Number of Asian Americans • 1990: Asian Pacific Islander vs. 2000: Asian • 1990: One Race vs. 2000: Multi-race (counted separately)
What’s “Asian American” 2 • “Asian Americans” is an aggregate term that combines very complex and diverse communities • Ethnicities in “Asian America” are very bi-modal and multi-modal
Asian Americans Are the Fastest Growing Group (% wise) in the U.S. and MA
Demographics • Relatively younger, particularly working age • Family-based • Complex, Polarized Picture of Socio-economic Status
Is There Significant Poverty among Asian Americans in Massachusetts?
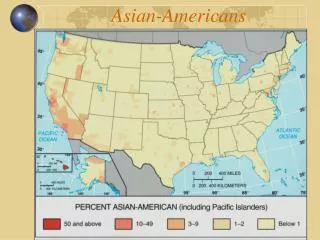
The Geography of AA Family Poverty • Lynn (22.6% Asian, 23.3% Cambodian compared to 16.5% Total Population) • Brockton (13.9% Asian, 26.1% Chinese compared to 12.1% Total Population) • Fall River (41.4% Asian, 61.2% Cambodian compared to 14.0% Total Population) • Quincy (11.8% Asian, 23.6% Vietnamese compared to 7.2% Total Population) • Worcester (27.7% Asian, 30.1% Vietnamese compared to 17.9% Total Population)
Poverty by Age for Asian Alone and General Population (as Percent of those in Poverty)
Poverty by Age for Asian Alone and General Population (as Percent of those in Age Group)