Download
1 / 2
20 likes | 139 Vues
Figure. Three scatter diagrams of the cDNA microarray in this study are shown as a supplementary figure. (Kitahara et al.). Table. cDNA microarray analysis in category of chemokines in this study is shown as a supplementary table. (Kitahara et al.).

E N D
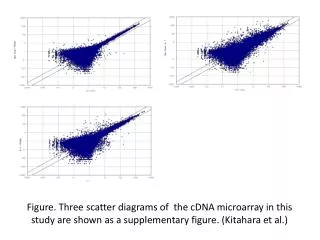
Figure. Three scatter diagrams of the cDNA microarray in this study are shown as a supplementary figure. (Kitahara et al.)
Table. cDNA microarray analysis in category of chemokines in this study is shown as a supplementary table. (Kitahara et al.) A: FK506(100nM) vs. non-treat B: IL-1(1ng/ml) vs. non-treat C: IL-1+FK506 vs. IL-1 (L): Low quality