The trouble with fructose
520 likes | 691 Vues
The trouble with fructose. Robert H. Lustig, M.D. Division of Endocrinology Department of Pediatrics University of California, San Francisco. ASTPHND, Madison, WI, June 8, 2008. Prediction of BMI distribution in adults, 2008. The entire curve has shifted. Hill et al. Science 299:853, 2003.

The trouble with fructose
E N D
Presentation Transcript
The trouble with fructose Robert H. Lustig, M.D. Division of Endocrinology Department of Pediatrics University of California, San Francisco ASTPHND, Madison, WI, June 8, 2008
Prediction of BMI distribution in adults, 2008 The entire curve has shifted Hill et al. Science 299:853, 2003
The First Law of Thermodynamics CaloriesIn Weight Gain CaloriesOut
Total Caloric Intake 275 kcal in teen boys Children 2-17 yrs, CSFII (USDA) 1989-91 vs. 1994-95 http://www.usda.gov/cnpp/FENR%20V11N3/fenrv11n3p44.PDF
Fat Intake: Grams 5 g (45 cal) in teen boys Children 2-17 yrs, CSFII (USDA) 1989-91 vs. 1994-95
Carbohydrate Intake: Grams 57 g (228 cal) in teen boys Children 2-17 yrs, CSFII (USDA) 1989-91 vs. 1994-95
Prevalence of Obesity Compared to Percent Calories from Fat Among US Adults Percent Year
Beverage Intake 41% soft drinks 35% fruit drinks Children 2-17 yrs, CSFII (USDA) 1989-91 vs. 1994-95
Beverage Intake 41% soft drinks 35% fruit drinks Children 2-17 yrs, CSFII (USDA) 1989-91 vs. 1994-95 One can of soda/day = 150 cal x 365 d/yr ÷ 3500 cal/lb = 15.6 lbs/yr!
Are soft drinks the cause of obesity? “There is no association between sugar consumption and obesity.” Richard Adamson Scientist for National Soft Drink Association BMJ 326, March, 2003 • Each additional sugar-sweetened drink increase over a 19 month follow-up • BMI 0.24 kg/m2 (95% CI: 0.1-0.39) • OR for obesity 1.6 (95% CI: 1.14-2.24) Ludwig et al. Lancet 2001
Meta-Analysis of Soft Drinks and Obesity 88 cross-sectional and longitudinal studies regressing soft drink consumption with — • energy intake r = 0.16 (P < 0.001) • body weight r = 0.08 (P < 0.001) • milk and calcium intake r = -0.12 (P < 0.001) • adequate nutrition r = -0.10 (P < 0.001) Those studies funded by the beverage industry demonstrated smaller effects than independent studies Vartanian et al. Am J Public Health epub March 2007; 10.2105/AJPH.2005.083782
Curtailing soft drinks limits childhood obesity Obesity Prevalence (%) James et al. BMJ 328:1237, 2004
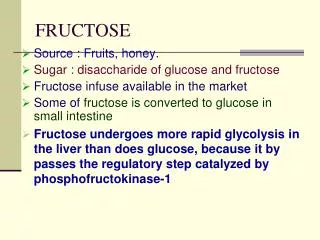
High Fructose Corn Syrup Current US annual consumption of HFCS • 63 pounds per person
Sucrose High Fructose Corn Syrup
Relative sweetness of various carbohydrates Fructose 173 invert sugar* 120 HFCS (42-55% fructose) 120 Sucrose 100 Xylitol 100 Tagatose 92 Glucose 74 high-DE corn syrup 70 Sorbitol 55 Mannitol 50 Trehalose 45 regular corn syrup 40 Galactose 32 Maltose 32 Lactose 15
From the Corn Refiners Association December, 2006
Unlikely Duo Opposes San Francisco Soft Drink Tax Plan Corn Refiners and CSPI Agree High-Fructose Corn Syrup No Worse Than Sugar WASHINGTON—The nonprofit Center for Science in the Public Interest has long supported small taxes on soft drinks to help pay for bike paths, nutrition education, and other obesity-prevention programs. But CSPI opposes a measure proposed by San Francisco Mayor Gavin Newsom because it would tax only drinks made with high-fructose corn syrup and not drinks made with other forms of sugar. Less surprisingly, the Corn Refiners Association also opposes the measure, but the two groups cosigned an unusual joint letter to Mayor Newsom urging him to reconsider his plan. “We respectfully urge that the proposal be revised as soon as possible to reflect the scientific evidence that demonstrates no material differences in the health effects of high-fructose corn syrup and sugar,” wrote CSPI executive director Michael F. Jacobson and Corn Refiners Association president Audrae Erickson. “The real issue is that excessive consumption of any sugars may lead to health problems.” The letter goes on to explain that high-fructose corn syrup and sucrose, or table sugar, are similar in composition and that several studies have shown that the two types of sugars are similarly metabolized by the body. Press Release, February 6, 2008
High Fructose Corn Syrup is 42-55% Fructose; Sucrose is 50% Fructose Glucose Fructose Sucrose
Juice is sucrose: Change in BMI z-score in lower socioeconomic status children versus number of fruit juice servings per day Faith MS et al. Pediatrics 118:2066, 2006
MOST FRUCTOSE ITEMS Sucrose JUICE High Fructose Corn Syrup
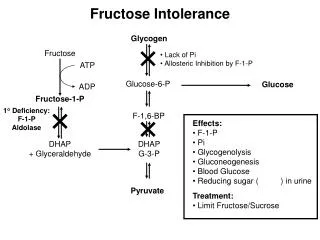
Fructose is not glucose • Fructose is 7 times more likely than glucose to form Advanced Glycation End-Products (AGE’s) • Fructose does not suppress ghrelin • Acute fructose does not stimulate insulin (or leptin) •Hepatic fructose metabolism is different •Chronic fructose exposure promotes the Metabolic Syndrome Gaby, Alt Med Rev, 2005 Le and Tappy, Curr Opin Clin Nutr Metab Care, 2006 Wei et al. J Nutr Biochem, 2006 Elliot et al. Am J Clin Nutr, 2002 Bray et al. Am J Clin Nutr, 2004 Teff et al. J Clin Endocrinol Metab, 2004
24 kcal Hepatocyte 96 kcal
Ethanol is a carbohydrate CH3-CH2-OH But ethanol is also a toxin
Acute ethanol exposure • CNS depression • Vasodilatation, decreased BP • Hypothermia • Tachycardia • Myocardial depression • Variable pupillary responses • Respiratory depression • Diuresis • Hypoglycemia • Loss of fine motor control Acute fructose exposure
60 kcal (+ 12 kcal glucose) 48 kcal
Isganaitis and Lustig, Arterio Thromb Vasc Biol 25:2451, 2006
Why is exercise important in obesity? Because it burns calories? Because it improves skeletal muscle insulin sensitivity Because it reduces stress, and resultant cortisol release Because it makes the TCA cycle run faster, and detoxifies fructose, improving hepatic insulin sensitivity
Chronic ethanol exposure • Hematologic disorders • Electrolyte abnormalities • Hypertension • Cardiac dilatation • Cardiomyopathy • Dyslipidemia • Pancreatitis • Malnutrition • Obesity • Hepatic dysfunction (ASH) • Fetal alcohol syndrome • Addiction Chronic fructose exposure • Hypertension • Myocardial infarction • Dyslipidemia • Pancreatitis (2o dyslipidemia) • Obesity • Hepatic dysfunction (NASH) • Fetal insulin resistance • Habituation, if not addiction
UCSF Weight Assessment for Teen and Child Health (WATCH) Clinic294 patients 2003-2006 • Biochemistry • Race/Ethnicity Mietus-Snyder et al. (submitted)
UCSF WATCH ClinicAssociations with the Metabolic Syndrome Mietus-Snyder et al. (submitted)
UCSF WATCH ClinicLifestyle Intervention • Get rid of all sugared liquids—only water and milk • Eat your carbohydrate with fiber • Wait 20 minutes for second portions • Buy your screen time minute-for-minute with physical activity Pts are followed every 3 months
UCSF WATCH Clinic Lifestyle Intervention:Median Change in BMI z-score from Baseline Madsen et al. (submitted)
UCSF WATCH Clinic Predictors of Lifestyle Intervention • Forward selection model, 4 variables Source | SS df MS Number of obs = 130 -------------+------------------------------ F( 4, 125) = 6.49 Model | .169200646 4 .042300161 Prob > F = 0.0001 Residual | .81467663 125 .006517413 R-squared = 0.1720 -------------+------------------------------ Adj R-squared = 0.1455 Total | .983877276 129 .007626956 Root MSE = .08073 ------------------------------------------------------------------------------ Delta z/yr | Coef. Std. Err. t P>|t| Beta -------------+---------------------------------------------------------------- sugared bev| .012786 .0048643 2.63 0.010 .2268616 HOMA| .0034239 .0018131 1.89 0.061 .1707474 Baseline BMIZ| .0311507 .0199972 1.56 0.122 .1430862 Baseline Age | .0027542 .0022543 1.22 0.224 .1055135 _cons | -.1475346 .0573037 -2.57 0.011 . ------------------------------------------------------------------------------ Madsen et al. (submitted)
The “fructosification” of America (and the world)
Can you name the seven foodstuffs at McDonald’s that don’t have HFCS or sucrose? French Fries (salt, starch, and fat) Hash Browns (salt, starch, and fat) Chicken McNuggets (salt, starch, and fat) Sausage Diet Coke Coffee Iced Tea
The SFUSD School Milk Program Courtesy of M. Lustig
What about WIC? J. Nutr. 136:1086, 2006
Could this be the reason for obesity with formula feeding? INGREDIENTS (Powder) ((U) Pareve*) 43.2% Corn syrup solids, 14.6% soy protein isolate, 11.5% high oleic safflower oil, 10.3% sugar (sucrose), 8.4% soy oil, 8.1% coconut oil Courtesy of M. Walker
What’s the difference? Calories 150 150 Percent CHO 10.5% (sucrose) 3.6% (alcohol) Calories from fructose 75 (4.1 kcal/gm) other carbs 75 (glucose) 60 (maltose) alcohol 90 (7 kcal/gm) 1st pass GI metabolism 0% 10% Calories reaching liver 90 92
Fructose is a carbohydrate Fructose is metabolized like fat (corollary: a low fat diet isn’t really low fat, because the fructose/sucrose doubles as fat) Fructose is also a toxin
DESIGN, MANUFACTURING AND MARKETING OF TOBACCO PRODUCTS: TOWARDS A SENSIBLE REGULATORY FRAMEWORKBates Number: 2065346777/6799, Page 3 … Under the regulations governing food additives, it’s required that additives be “safe”, defined as a reasonable certainty by competent scientists that no harm will result from the intended use of the additive. 21 C.F.R. Sec. 170(3)(I)(1998). Using this standard, numerous additives generally thought of as “fat”, including fatty acids, cocoa butter substitute, epoxidized soybean oil and the like are permitted to be used in ordinary course. HFCS has FDA GRAS status (Generally Regarded as Safe) Philip Morris (Altria) Company: From the UCSF Legacy Tobacco Documents Library
DESIGN, MANUFACTURING AND MARKETING OF TOBACCO PRODUCTS: TOWARDS A SENSIBLE REGULATORY FRAMEWORKBates Number: 2065346777/6799, Page 3 … Although there is no existing regulatory framework permitting FDA to restrict a consumer’s choice to consume high fat foods, such products are, like all food products, subject to general FDA requirements regarding adulteration and misbranding. See e.g. 21 U.S.C. Sec 402(a) “A food shall be deemed to be adulterated if it bears of contains any poisonous or deleterious substance which may render it injurious to health”….Thus, under existing law the agency is charged with the responsibility of ensuring that consumption of high fat (and all other) food products does not result in acute injuries such as poisoning, and with preventing consumers from being misled, but not with the prevention of chronic diseases even though its own regulations explicitly postulate the connection between such products and such diseases. Philip Morris (Altria) Company: From the UCSF Legacy Tobacco Documents Library
Summary • Fructose (sucrose vs. HFCS) consumption has increased in the past 30 years, coinciding with the obesity epidemic • Fructose is everywhere • A calorie is not a calorie, and fructose is not glucose • Hepatic fructose metabolism leads to all the manifestations of the Metabolic Syndrome: hypertension de novo lipogenesis, dyslipidemia, and hepatic steatosis inflammation hepatic insulin resistance obesity CNS leptin resistance, promoting continuous consumption • Fructose ingestion interferes with obesity intervention • Fructose is a chronic hepatotoxin (it’s “alcohol without the buzz”) but FDA can’t and won’t regulate it