Download
1 / 6
60 likes | 141 Vues
Comparison of chromosome loss rates in wild type, single mutants nkp2∆ and iml3∆, and double deletion strain nkp2∆iml3∆. Analysis of mating ability in CTF19 complex mutants. Evaluation of Nkp2 expression and localization in various mutants.

E N D
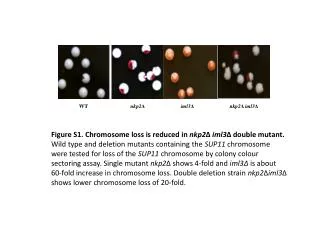
WT nkp2Δ iml3Δ nkp2Δ iml3Δ Figure S1. Chromosome loss is reduced in nkp2Δ iml3Δ double mutant. Wild type and deletion mutants containing the SUP11 chromosome were tested for loss of the SUP11 chromosome by colony colour sectoring assay. Single mutant nkp2Δ shows 4-fold and iml3Δ is about 60-fold increase in chromosome loss. Double deletion strain nkp2Δiml3Δ shows lower chromosome loss of 20-fold.
Chromosome III loss rate (%) nkp2Δ nkp2Δ nkp2Δ nkp2Δ nkp2Δ nkp2Δ nkp2Δ ctf3Δ nkp2Δ mcm22Δ nkp2Δ mcm16Δ nkp2Δ nkp1Δ nkp2Δ nkp2Δ mcm22 Δ nkp2Δ ctf3Δ nkp1Δ mcm16Δ mcm21Δ nkp2Δ ctf19Δ nkp2Δ WT iml3Δ nkp2Δ iml3Δ mcm21Δ ctf19Δ mcm17Δ nkp2Δ mcm17Δ Figure S2. Quantitative mating assay in CTF19 complex mutants. Chromosome loss rates was measured in CTF19 single mutants and double mutants of nkp2Δwith individual CTF19 mutants, diploid cell loss one copy of chromosome III and able to mate with opposite mating tester. Blue bar represents the nkp2Δ, red bar represents the CTF19 individual single mutants and green bar represents the double mutants of nkp2Δwith individual components of CTF19 single mutant.
nkp2Δ iml3 Δ mcm21Δ ctf19Δ mcm22Δ WT Nkp2 40 kDa 63kDa Sir2 Figure S3. Nkp2 expression is similar as wild type and ctf19 mutants. Total proteins was extracted from wild type and different ctf19 mutants containing the NKP2-13xmy. Proteins were separated on SDS-PAGE and subjected to immunobloting to detect the Nkp2 in ctf19subcomplex mutants. The same blot was hybridized to Sir2 polyclonal antibody to check levels of protein loading.
Nkp2 Mps3 DAPI Merge nkp1 iml3 mcm17 Figure S4. Localization of Nkp2 was similar as wild type. Immunolocalization of Nkp2 in nkp1Δ, iml3Δ and mcm17Δ mutants. Nkp2 (green) localizes to a prominent foci in the nucleus that colocalizes with Mps3 (red), which stains the spindle pole body. Nucleus is demarcated by DAPI(blue) Scale bar is 2µm.
Wt ctf19 mcm21 nkp1 Figure S5: Live cell imaging shows mislocalization of Nkp2 in mcm21 and ctf19 mutants. Widltype, ctf19, mcm21 and nkp1 mutants containing Nkp2-Gfp and Spc42-DsRed were imaged in a fluorescence microscope.Nkp2-Gfp is green and Spc42 is in red. DAPI in blue shows the nucleus.
Figure S6: Chromosome loss upon elevated gene dosage of NKP2 in ctf19 and mcm21 mutants. Chromosome loss rate was measured in ctf19,mcm21, nkp1 and mcm17 single mutants upon elevated dosage of NKP2 by colour-based colony sector assay. Chromosome loss was elevated in ctf19 and mcm21 upon NKP2 overexpression. Black bars represent mutants with empty vector and grey bar represents mutants with NKP2overexpression