Download

1 / 39
390 likes | 557 Vues
Team Redwood Heart Rate Monitor. Advisor Dr. Joseph Hoffbeck , Dr. Peter Osterberg Industry Representative Andrew Owings (Nike). Team Dan Allenby Preston Boyd Kyle Yakubisin Ross Yamaguchi. Agenda. Introduction Dan Allenby Background Dan Allenby Methods Ross Yamaguchi

E N D
TeamRedwoodHeartRateMonitor • Advisor • Dr. Joseph Hoffbeck, • Dr. Peter Osterberg • Industry Representative • Andrew Owings (Nike) Team Dan Allenby Preston Boyd Kyle Yakubisin Ross Yamaguchi University of Portland School of Engineering
Agenda • Introduction Dan Allenby • Background Dan Allenby • Methods Ross Yamaguchi • Results Kyle Yakubisin • Conclusions Preston Boyd • Demonstration Team Redwood University of Portland School of Engineering
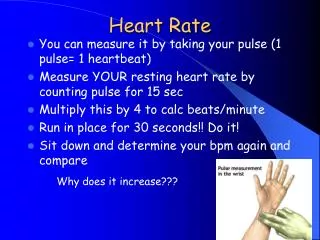
Introduction • Team Redwood’s Concept: • Chose to integrate electrical engineering with human physiology. • In what manner to do this. • Heart health is significant in everyday life. • HRmax = 220 − Age Founder’s Day University of Portland School of Engineering
Introduction (Cont’d) • The Idea: • Heart Rate Monitor Founder’s Day University of Portland School of Engineering
Background • The Goal: • Measure a user’s heart rate using advanced technology commonly found in the industry. • Calculate heart rate and display accurate • values in an easily readable format. • - Analog input – Digital processing – Analog output. Founder’s Day University of Portland School of Engineering
Methods • Determine the scope of the project • Began conceptualizing in May 2009 • Determine the functionality of the project • Conventional measurement • Accurately calculate user’s heart rate • Easily visible display • Updates every second • How do we produce this functionality • Choose to utilize MOSIS technology Founder’s Day University of Portland School of Engineering
Methods (Cont’d) • Integration of all parts into a single unit • Make analog circuitry compatible with MOSIS • Testing and De-bugging • Check and Recheck • Adjust design for unforeseen complications Founder’s Day University of Portland School of Engineering
Results University of Portland School of Engineering
Results (Cont’d) • Sp02 Sensor • Records the amount of hemoglobin in red blood cells that pass through the user’s finger. • The sensor generates a current that fluctuates with each heartbeat. • Analog Signal Processing Circuits • The information from the fingertip sensor must then be characterized and processed by analog circuitry consisting of several 741 op amps and a Schmitt Trigger. University of Portland School of Engineering
Results (Cont’d) • Analog Signal Processing Circuits (cont’d) • These components interface to characterize the signal from the Sp02 sensor into a format that the MOSIS Chip can calculate. • MOSIS • Calculates the user’s heart rate and outputs to the LED drivers in a beats per minute format. • LED • Used to display the user’s calculated heart rate. University of Portland School of Engineering
Results (Cont’d) • Analog Circuit Schematic University of Portland School of Engineering
MOSIS Chip • Input is 1-bit signal from Analog Signal Processing Circuits • Calculates and Controls Desired Output • Output is Three 4-bit BCD Digits that are sent to the display
Z-1 Sampler Divider Unit Beat 11-Bit Counter 11-Bit Register Comparator If beats <= 230 Binary to BCD Converter Clock 12-Bit Register 10-Bit Counter Heart Rate MOSIS Block Diagram Sampler
Sampler BEAT Time BEAT PULSE Time
Z-1 Sampler Divider Unit Beat 11-Bit Counter 11-Bit Register Comparator If beats <= 230 Binary to BCD Converter Clock 12-Bit Register 10-Bit Counter Heart Rate MOSIS Block Diagram
IF HR=0 IF HR=E Reset 16-Bit Quotient Register 32-Bit Divisor Register 32-Bit Subtraction 8-Bit Output Register Beats Heart Rate 32-Bit Multiplexer 32-Bit Remainder Register Clock 5-Bit Counter Divider Unit
Division Algorithm System Clock Frequency = 960 Hz Beats = Clock cycles between pulses
Drivers Displays MOSIS Heart Rate Calculator and Output Controller TI Driver 8 HR0_(0-3) 7-Bit Signal TI Driver 8 HR1_(0-3) 7-Bit Signal TI Driver 8 HR2_(0-3) 7-Bit Signal Display
B2 Logic Gate Schematic University of Portland School of Engineering
LEDIT Mask Layout University of Portland School of Engineering
System Results University of Portland School of Engineering
Results (Cont’d) University of Portland School of Engineering
Conclusion • Heart Rate Monitor • We have some error caused by noise • All of the sections spoken about earlier came together to create this prototype • Advice to juniors and sophomores • The early and hard deadline of MOSIS was very nice • Try to get ahead whenever possible • Plan & allow for plenty of time to get tasks done University of Portland School of Engineering
Conclusion (Cont’d) • If we had more time: • We would like to further clean up the signal • Improve the accuracy of the system clock Thus, improving the accuracy of the entire system. • Possible continuation projects: • Calculate & display the user’s %Sp02 • Wearable size and power source University of Portland School of Engineering
Special Thanks • Dr. Joseph Hoffbeck • Dr. Peter Osterberg • Andrew Owings of Nike • Grant from the MOSIS Educational Program (MEP) • To everyone else that assisted us in any way University of Portland School of Engineering
Demonstration University of Portland School of Engineering
Thank You. Are there any questions? University of Portland School of Engineering
Z-1 Sampler Divider Unit Beat 11-Bit Counter 11-Bit Register Comparator If beats <= 230 Binary to BCD Converter Clock 12-Bit Register 10-Bit Counter Heart Rate MOSIS Block Diagram
11-Bit Counter and Register • Counts from 0 to 2047 then halts. • If value is 2047 control signal is sent to Output Register so output is set to zero. • Beat Pulse loads current value of counter to register then resets the counter to zero.
Z-1 Sampler Divider Unit Beat 11-Bit Counter 11-Bit Register Comparator If beats <= 230 Binary to BCD Converter Clock 12-Bit Register 10-Bit Counter Heart Rate MOSIS Block Diagram
Comparator • 11-Bit Value representing the clock cycles from last count is inputed. • If input is less than 230 then control signal is set to logic high. • An input less than 230 represents an error.
Start 1. Subtract the Divisor register from the Remainder register and place the result in the Remainder register. Remainder < 0 Remainder ≥ 0 Test Remainder 2a. Shift the Quotient register to the left, setting the most significant bit to 1 2b. Restore the original value by adding the Divisor register to the Remainder register and place the sum in the Remainder register. Also shift the Quotient register to the left, setting the new least significant bit to 0 3. Shift the Divisor register right 1 bit 17th repetition? No: < 17 Repetitions Yes: 17 repetitions Done Division Algorithm
Z-1 Sampler Divider Unit Beat 11-Bit Counter 11-Bit Register Comparator If beats <= 230 Binary to BCD Converter Clock 12-Bit Register 10-Bit Counter Heart Rate MOSIS Block Diagram
BCD to Binary Converter • Converts 8-Bit binary value to Binary Coded Decimal. • Each block is a conditional adder. • If input is >= 5 then 3 is added to value, else the input is copied to the output.