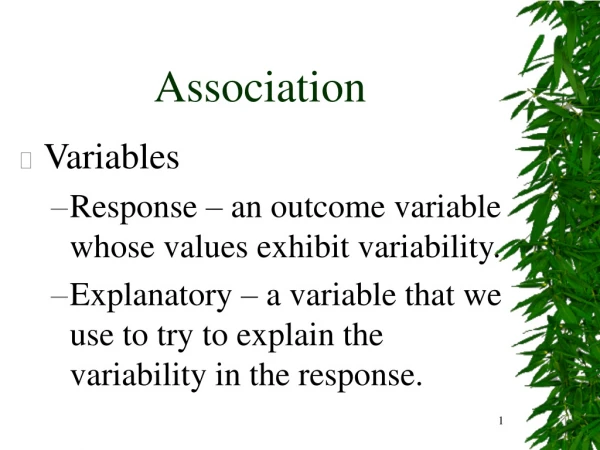
Association
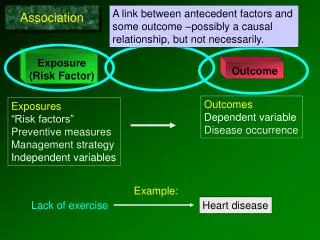
Exposure (Risk Factor). Outcome. A link between antecedent factors and some outcome –possibly a causal relationship, but not necessarily. Association. Outcomes Dependent variable Disease occurrence. Exposures “Risk factors” Preventive measures Management strategy Independent variables.

Association
E N D
Presentation Transcript
Exposure (Risk Factor) Outcome A link between antecedent factors and some outcome –possibly a causal relationship, but not necessarily. Association Outcomes Dependent variable Disease occurrence Exposures “Risk factors” Preventive measures Management strategy Independent variables Example: Lack of exercise Heart disease
Diseased & Exposed Diseased & non-exposed Non-diseased & exposed Non-diseased & non-exposed
Descriptive Studies Analytical Studies Evolution of Information Case Report Case-Series Cross-Sectional Correlational Description; Hypothesis Generation Compare groups Case-Control Cohort Study Hypothesis testing Clinical Trial (Intervention Study) Evaluation of Intervention
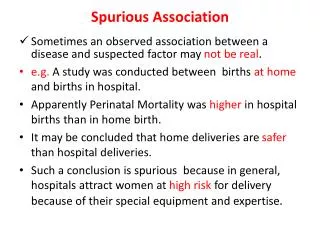
In analytic studies one enrolls subjects from the general population and groups them in some way to make comparisons that test association between risk factors and outcomes. Inference Target Population Sample Study population • Are the results valid? • Chance • Bias • Confounding • Collect data • Make comparisons Is there an association?
Two Basic Strategies for Testing Associations • Cohort type of study • Case-Control study
X X X Compare Incidence Time passes X Cohort Type Studies Exposed Non-Exposed X Case-Control Study X X X X X X X Diseased Compare odds of exposure to risk factor Assess prior exposures Non-Diseased
Weymouth, MA. Surveillance system for reportable infectious diseases identifies a case of Salmonella food poisoning. Subsequent surveillance and active case finding revealed a substantial number of recent cases.
Based on the descriptive epidemiology, it is clear that the parent-teacher luncheon is the source of the outbreak (presumably one of the food dishes). But which food dish was responsible?
We have a well-defined group (cohort) and a number of suspect exposures (foods). An intuitive approach would be to ask all attendees in the cohort what they ate (the exposures). Then, for each food compare the incidence of illness in those who ate it and those who did not.
Case definition: Anyone who attended the luncheon and became ill with diarrhea and/or vomiting or tested positive for SE any time within 5 days following the event. A questionnaire was administered. There were 45 attendees who completed the questionnaire. Of these 26% fit the case definition. How would you identify the cause?
For example Among the respondents, 23 reported having eaten a cheese appetizer. 16 of these people became ill. 22 denied eating the cheese. 9 of these people became ill? Was the cheese the culprit? Is there evidence of an association between eating the cheese appetizer (exposure) and developing Salmonellosis (outcome)?
Diseased & Exposed Diseased & non-exposed Did those who were exposed to a given dish have a higher probability of disease compared to … Non-diseased & exposed … those who were not exposed? Non-diseased & non-exposed
Method #1 for sampling: identify exposed people & non-exposed people and compare their risk of disease. (Esp. useful for rare exposures, like asbestos.) 14 Exposed? 28 Risk in exposed = 6/14 = 43%; risk in unexposed = 4/28 = 14%
Yes No 2 x 2 Table Summarizing Data Salmonellosis Incidence Yes No 93% 25 2 27 Ate Manicotti 6% 1 17 18
Ate Cheese?
Probability of illness (risk)? 16/23 = 0.70 9/22 = 0.41 Ate Cheese? How did the probabilities compare? Risk Ratio = 0.70 / 0.41 = 1.71
Risk Ratio They looked at each of the risk factors with a separate 2x2 table. The summary of the results looked like this. The source?
X Cohort Study Key question: Did people with a particular “exposure” have a greater incidence (risk) of disease? Ate manicotti X X X Compare Incidence No manicotti Did people who ate manicotti have a greater incidence of Salmonella?
93% Relative Risk = = 16.7 6% Comparing Incidence -Relative Risk (Risk Ratio) How many times greater was risk in those exposed to manicotti? 93% became ill 6% became ill “The risk of Salmonellosis was 16.7 times greater in people who ate manicotti compared to those who didn’t.”
X X X Compare Incidence Time passes X Cohort Study People who attended the luncheon. Manicotti No manicotti
Salmonella Outbreak at the Appreciation Luncheon A small, well-defined cohort. • The source population was small and discrete (attendees of appreciation luncheon) & there was the ability to contact all members of the cohort or a substantial proportion of them. • They could list all foods served at the luncheon & ask each respondent which foods they ate & whether they got sick. • They could, therefore, determine the exposure status & outcome status for the majority of the cohort. So, they could calculate incidence and RR for each food item. • The disease was common; 58% of the cohort got it.
Hepatitis Outbreak in Marshfield, MA • “Between February 25 and 27, 2004 six cases of HAV infection in Marshfield residents were reported to …MDPH. In addition, a case of hepatitis A in a Plymouth resident, employed in Marshfield, was reported.” (eventually there were 20 cases). • Marshfield had 1 case in 2002 and 0 cases in 2003 • “The increase in the number of reported cases … during February in a confined geographic area was an indication of a possible outbreak of hepatitis A infection.”
Biology and Transmission of Hepatitis A (virus) • Abrupt onset: fever, malaise, anorexia, nausea, and abdominal discomfort; sometimes diarrhea. Jaundice may follow. May be asymptomatic. Infected humans (symptomatic or not) shed the virus into stools. • Transmission: fecal-oral route (ingesting the virus) • food contaminated by an infected food worker • produce irrigated/processed with contaminated water • shellfish from contaminated water • drinking feces-contaminated water • sexual: (e.g., oral-anal contact). • Incubation period: 15–50 days (avg.= 28–30). • Most infectious from 1–2 weeks before symptoms until 1 week after.
Descriptive Phase: generate hypotheses about the sources. • Person:characteristics? • Place:specific locations or setting? • Time:does it vary over time?
Based on these clues: • Knowledge of biology of hepatitis A (transmission, incubation) • Time course: epidemic curve of “point source” • Diverse age, occupation, location • Interview with a series of cases & similarities in restaurant use They hypothesized that the source was probably an infected food handler at: Rick’s Deli McDonald’s Jaime’s Pub Papa Gino’s Friendly’s
Hepatitis Outbreak – Problems • No clear cohort and only a small # of cases scattered across South Shore. (rare outcome) • No obvious event/place that tied them all together. The source population was large & diffuse with unknown borders, and only 20 cases had been identified. • They couldn’t interview all residents of MA South Shore.
Of the thousands of people exposed at the responsible restaurant, only a small % became ill. So if we took a random sample of people who ate at each restaurant, the incidence might be 0 even in the offending restaurant.
The disease is rare. There is a fairly large number of exposed individuals in the state, but most of these are not diseased. The proportion of exposed individuals among the disease cases is higher than the proportion of exposure among the controls. (There is an association.)
A Rare Outcome If I somehow had exposure and outcome information on all of the subjects in the source population and looked at the association using a cohort design, it might look like this: If we are calculating the risk ratio, the key information is The exposure distribution in the cases relative to the exposure distribution in the total population.
Point #1: In this situation, the probability of disease in the exposed is about the same at the odds of disease in the exposed, & same is true for the non-exposed. 7/1007 is about the same as 7/1000. 6/5640 is about the same as 6/5634. So, if I computed the odds ratio: (odds of disease in exposed / odds of disease in non-exposed) It would be about the same as the risk ratio.
Point #2: If we are calculating the risk ratio, the key information is the exposure distribution in the cases relative to the exposure distribution in the total population. And the exposure distribution in non-diseased is similar to total population. (7/1007) (6/5640) = 6.53 1.16667 0.1785 (7/6) (1007/5640) = 6.53 = 6.53
Point #3: If the key information is the exposure distribution in the cases relative to the exposure distribution in the total population, then we could just take a sample of the non-diseased people in order to estimate the exposure distribution in the total population. (7/1007) (6/5640) = 6.53 1.16667 0.1785 (7/6) (10/56) = 6.53 = 6.53
In other words, if I want to estimate a risk ratio for a rare disease, it is more efficient to find cases, but then just take a sample of non-diseased “controls” in order to estimate the exposure distribution in the entire population. (7/1007) (6/5640) (7/6) (10/56) = 6.53 = Risk Ratio = 6.53 = Odds Ratio
Method #2 for sampling: diseased people & non-diseased people and compare their odds of having been exposed.. (Esp. useful for rareoutcomes, e.g., birth defects.) Exposed? Odds of exposure = 6/4; odds of exposure =8/24
With no defined cohort and a rare outcome, the case-control strategy is much more efficient: Find as many sick people(cases) as you can and ask them about all their exposures (where they ate). Then find non-affected people(controls) and ask them about the same exposures. You can’t measure incidence, but you can measure the odds of exposure to each restaurant in the cases (sick people) and compare to the odds of exposure in well people (controls).
X X X X X X X X Case-Control Study • Design: • Find cases with disease; find non-disease ‘controls’. • Compare the groups with respect to past exposures. People with Hepatitis A (cases) Compare odds of eating at …. Assess prior exposures People without it (controls)
Evaluating Multiple Possible Risk Factors Hepatitis Control Case Odds of Eating at: 3 5 Yes Rick’s Deli 6 24 Yes No McDonald’s Yes 7 0 No Jaime’s No 6 8 Yes Friendly’s 1 32 No
Controls Cases X X X X X X X X How would you compare the groups to test the association? Hepatitis (cases) (controls) Hepatitis Yes No Assess prior exposures 18 7 Yes Ate at Rick’s Deli No 1 29 19 36
Controls Cases The Odds Ratio A case-control study comparing odds of exposure. Hepatitis Yes No 18/1 7/29 Odds Ratio = 18 7 Yes Ate at Rick’s Deli = 75 No 1 29 Hepatitis cases were 75 times more likely to have eaten at the Deli. 19 36 Odds of exposure: 18/1 7/29
Hepatitis AOutbreak Results:
X X X Compare Incidence Time passes X Cohort Type Studies X Case-Control Study X X X X X X X Assess prior exposures Compare odds of exposure to risk factor
Key Differences Between Cohort & Case-Control: Enrollment Strategy and What They Compare Giardiasis Cohort Yes No Disease-free subjects are enrolled and then grouped by their exposure; then compare incidence. + 16 108 124 Risk Factor - 14 341 355 Hepatitis A Case Control Case-Control 18 7 + Risk Factor Find diseased subjects and a non-diseased comparison group; ompare odds of exposure. - 1 29 (Ate at Deli) 19 36
Is There an Association Between Physical Inactivity and Heart Disease? Heart disease is a chronic disease. Which study design should we use?
Or we could use a cohort type of design. Have the Risk Factor (Inactive) X X X Compare Incidence Time passes Disease-free subjects X Don’t Have It (Active) A difference in incidence suggests that the exposure is associated with the disease.
We could use a case-control design. X X X People with CAD (cases) X X X X X Assess prior exposures Compare odds of exposure. “Were you inactive?” A difference in odds of exposure suggests an association. People without CAD (controls)
Choice of study design will depend on • degree of existing knowledge, • whether the outcome is rare, • whether the exposure is unusual, • resources, time, money.