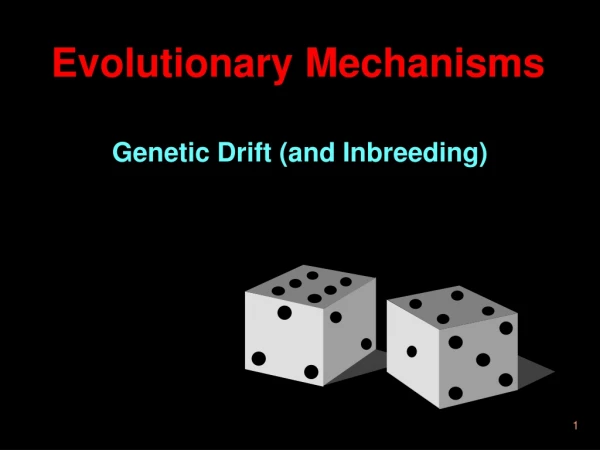
Evolutionary Mechanisms
850 likes | 1.93k Vues
Evolutionary Mechanisms. Genetic Drift (and Inbreeding). Sources of Genetic Variation. Mutation generates genetic variation Epigenetic modification changes expression of genes Genetic Drift causes fluctuations in allele frequencies and can reduce genetic variation. Natural Selection.

Evolutionary Mechanisms
E N D
Presentation Transcript
Evolutionary Mechanisms Genetic Drift (and Inbreeding)
Sources of Genetic Variation Mutation generates genetic variation Epigenetic modification changes expression of genes Genetic Driftcauses fluctuations in allele frequencies and canreduce genetic variation Natural Selection Natural Selection acts on genetic or epigenetic variation in a population Without genetic or epigenetic variation, Natural Selection cannot occur
Sources of Genetic Variation Mutation generates genetic variation Epigenetic Inheritance changes expression of genes Genetic Driftcauses fluctuations in allele frequencies and canreduce genetic variation Natural Selection Natural Selection acts on genetic or epigenetic variation in a population Without genetic or epigenetic variation, Natural Selection cannot occur
Today’s OUTLINE: (1) Migration (2) Genetic Drift (3) Effective Population Size (4) Model of Genetic Drift (5) Heterozygosity (6) A Consequence of Genetic Drift: Inbreeding
Migration (fairly obvious) • Can act as a Homogenizing force (If two populations are different, migration between them can reduce the differences) • A population could go out of HW equilibrium with a lot of migration
Impact of Migration • Immigration: could introduce genetic variation into a population • Emigration: could reduce genetic variation in a population
Random Genetic Drift Sewall Wright(1889-1988)
Sewall Wright(1889-1988) • • Sewall Wright worked on agricultural stocks (e.g. cows), and was consequently interested in small, inbred populations • Thus, he regarded Inbreeding and Genetic Drift as particularly important genetic mechanisms • Genetic Drift and Inbreeding could generate new gene interactions • • These new gene interactions (epistasis caused by new recombinations) are the main substrate for selection
Even after the synthesis the relative importance of Natural Selection and Genetic Drift were debated • During the Evolutionary Synthesis, Sewall Wright focused more on importance of Genetic Drift, whereas Fisher focused on Natural Selection • Shortly after the Evolutionary Synthesis many focused on selection to the point of assuming that most phenotypes were the result of Natural Selection • Emphasis on Genetic Drift resurged in the 1970s, 80s with Kimura’s “Neutral Theory” • Then in the 2000s and 2010s interest in Selection increased with the ability to detect signatures of Natural Selection in genome sequence data
Motoo Kimura (1924-1994) The Neutral Theory of Molecular Evolution Classic Paper: Kimura, Motoo. 1968. Evolutionary rate at the molecular level. Nature. 217: 624–626. Classic Book: Kimura, Motoo (1983). The neutral theory of molecular evolution. Cambridge University Press.
Molecular Clock Observations of amino acid changes that occurred during the divergence between species, show that molecular evolution (mutations) takes place at a roughly constant rate. This suggests that molecular evolution is constant enough to provide a “molecular clock” of evolution, and that the amount of molecular change between two species measures how long ago they shared a common ancestor. From this, Kimura concluded that most molecular evolution is “neutral” and dominated by random mutations and genetic drift. Figure: the rate of evolution of hemoglobin. Each point on the graph is for a pair of species, or groups of species. From Kimura (1983).
The Neutral Theory of Molecular Evolution (Lecture #6) • The Neutral theory posits that the vast majority of evolutionary change at the molecular level is caused by random genetic drift rather than natural selection. Motoo Kimura • Neutral theory is not incompatible with Darwin's theory of evolution by natural selection: adaptive changes are acknowledged as present and important, but hypothesized to be a small minority evolutionary change. • Purifying selection (negative selection) could still be acting to remove deleterious mutations from the genome. But, the idea here is that most of the genetic variation within and between populations is due to neutral variation (mutations and genetic drift). • **Ongoing debate on the extent to which variation across the genome is caused by genetic drift vs. natural selection
I. Random Genetic Drift • Definition: Changes in allele frequency from one generation to the next simply due to chance (sampling error). • This is a NON ADAPTATIVE evolutionary force. • Darwin did not consider genetic drift as an evolutionary mechanism, only natural selection.
Genetic Drift • Genetic Drift happens when populations are limited in size, violating HW assumption of infinite population size • When population is large, chance events cancel each other out • When population is small, random differences in reproductive success begin to matter much more
Effective Population Size • In Evolution, when we talk about population size, we mean effective population size
Effective Population Size The concept of effective population size Newas introduced by Sewall Wright, who wrote two landmark papers on it (Wright 1931, 1938). • Sewall Wright defined it as "the number of breeding individuals in an idealized population that would show the same amount of dispersion of allele frequencies under random genetic drift or the same amount of inbreeding as the population under consideration” • Or, thesize of an idealized Wright-Fisher population that would have the same increase in homozygosity and the same random drift in allele frequencies as in the actual population considered. • Or, put simply, the population size based on its genetic variation
Effective Population Size • The effective population size is always either equal to or less than the census population size (N). • The effective population size is usually smaller than the real census population size because not everyone breeds and leaves offspring. • Unequal sex ratio, variation in number of offspring, overlapping generations, fluctuations in population size, nonrandom mating could lead to an effective population size that is smaller than the census size. • Ne= 4NmNf (Nm+Nf) where Nm = number of males, Nf = number of females from this equation, you can see that unequal sex ratio would lead to lower Ne
Why do we care about effective population sizeNe? • Because Ne is the actual unit of evolution, rather than the census size N • Why? Because only the alleles that actually get passed onto the next generation count in terms of evolution… the individuals that do not mate or have offspring are evolutionary dead ends… • If a population is completely inbred, its Ne = 1, even if the census size is large
Chance Events (no Selection) There is always an element of chance, in: • Who leaves Offspring • # of Offspring • Which Offspring survive (which gametes, which alleles)
Example of sampling error Greenfur:G(dominant) Bluefur:b(recessive) If GbxGb mate, the next generation is expected to have: 3:1Ratio ofGreentoblue(GG,Gb,bG,bb) But this might not happen One family could get this unusual frequency just due to chance:You might get: bb,bb,bb,bb • And, so you might accidentally lose the G allele not for any reason, but just due to chance The larger the population, the more these effects average out, and frequencies approach HW equilibrium
Why is this not Selection? Selection happens when some survive for a reason: better adapted. Genetic Drift is just a numbers game. Which gamete gets fertilized, which allele gets passed on isRANDOM
Consequences of Genetic Drift Random fluctuations in allele frequency If population size is reduced: 1. At the Allelic level:Random fixation of Alleles (loss of alleles) 2. At the Genotypic level:Loss of Heterozygosity (because of fewer alleles)
Probability of loss of alleles is greater in smaller populations • For example, if there are 50 different alleles in population • …and a new population is founded by only 10 individuals • Then the new population will be unable to capture all 50 alleles, and many of the alleles will be lost
Random fixation of alleles FIXATION: When an allele frequency becomes 100% The other alleles are lost by chance Fluctuations are much larger in smaller populations
Probability of fixation of an allele • Probability of fixation of an allele = the allele’s starting frequency (Sewall Wright 1931) • That is, if the frequency of an allele is 0.10 (10% in the population), then its probability (chances) of fixation (going to 100% in the population) is 0.10, or 10%
Probability of fixation of an allele • What is the Probability of fixation of an allele if its starting frequency is 0.20, or 20%? • What is the Probability of fixation of an allele if its starting frequency is 0.60, or 60%?
Probability of fixation of an allele • Probability of fixation of an allele = the allele’s starting frequency (Sewall Wright 1931) • That is, if the frequency of an allele is 0.10 (10% in the population), then its probability (chances) of fixation (going to 100% in the population) is 10% WHY?
Probability of fixation of an allele • If a population has 2N alleles • The probability of each allele being fixed = • If there are X # copies of that allele in the population, then the probability of fixation for that allele is • This is the proportion (%) of alleles in the population
Genetic Drift: Random Fixation After 7 generations, all allelic diversity was lost… the population became fixed for allele #1 just due to chance
Genetic Drift during Human Migrations Native American Pacific Islander Asian Frequency of allele Loss of Alleles European Middle Eastern NE African Figure. 20.32 Tishkoff et al. 1996 Sub-Saharan African Alleles at a locus
Loss of CYP (detoxification) alleles moving away from African Zhou et al. 2017. Worldwide Distribution of Cytochrome P450 Alleles: A Meta‐analysis of Population‐scale Sequencing Projects https://ascpt.onlinelibrary.wiley.com/doi/full/10.1002/cpt.690 Greatest diversity in Africa, loss as you leave Africa
Genetic Drift: Random Fixation As populations get smaller, the probability of fixation or extinction of alleles go up
Heterozygosity • Heterozygosity: frequency of heterozygotes in a population (% of heterozygotes) • Often used as an estimate of genetic variation in a population • HW expected frequency of heterozygotes in a population (at a locus with two alleles) = 2p(1-p) • As genetic drift drives alleles toward fixation or loss, the reduction in number of alleles causes the frequency of heterozygotes to go down
Heterozygosity The Expected Heterozygosity following a population bottleneck (accounting for population size) (frequency of Heterozygotes in the next generation = Hg+1): Note in this equation that as population size 2Ne gets small, heterozygosity in the next generation Hg+1, goes down g g+1 e
Grey line = theoretical expected heterozygosity: e Blue line = observed heterozygosity(% heterozygotes in population) g g+1
Loss of Variation Allele frequencies 0.36 0.16 Lots of Alleles: 0.20 0.24 0.04
Lots of alleles --> Lots of genotypes: Possible genotype combinations
Loss of Allelic Variation Allele frequencies 0.53 • Due to Genetic Drift 0.067 0.20 0.20 0
Loss of Allelic Variation due to Genetic Drift results in Increased Homozygosity Fewer possible genotype combinations Increase in homozygosity
No Genetic Variation = No Natural Selection Selection has nothing to act on
Genetic Drift and Natural Selection • Because of the randomness introduced by Genetic Drift, Natural Selection is less efficient when there is genetic drift • Thus, Natural Selection is more efficient in larger populations, and less effective in smaller populations
Allele A1 Demo • Impact of Effective Population Size • Impact of starting allele frequency • Interaction between Natural Selection and Genetic Drift
How do you detect Genetic Drift? • Random fluctuations in allele frequencies • Fluctuations in non-coding and non-functional regions of the genome • The same pattern of fluctuations across these regions of the genome (same demographic factors would act across the genome) - but mtDNA not same • Fluctuations in allele frequencies correspond to demography of the population (population size)
Consequences of Genetic Drift ---> Random fluctutations in allele frequency If population size is reduced and Drift acts more intensely, we get: 1. At the Allelic level:Random fixation of Alleles (loss of alleles) 2. At the Genotypic level:Inbreeding, Reduction in Heterozygosity (because of fewer alleles)