Download
1 / 21
210 likes | 367 Vues
Calanus finmarchicus diapause stock in the Gulf of Maine crashed during Autumn 1998. HYPOTHESIS: C. finmarchicus - an indicator of climate-driven changes in ocean circulation?.

E N D
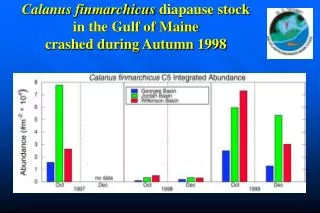
Calanus finmarchicus diapause stock in the Gulf of Maine crashed during Autumn 1998
HYPOTHESIS:C. finmarchicus - an indicator of climate-driven changes in ocean circulation? • Since shelf populations of C. finmarchicus are not self-sustaining and must be supplied every year or every few years from external sources, we hypothesize that their fluctuations in abundance reflect climate-driven changes in ocean circulation.
The North Atlantic Oscillation (NAO) NAO - -Weak H and L pressure cells - Westerlies weaken - Storm track shifts South • NAO + • - Strong H and L pressure cells • - Westerlies strengthen • Storm track shifts North
North Atlantic Ocean Circulation Responses to the NAO Emphasis on NW Atlantic NAO + - Enhanced production of LSW and intensification of DWBC - Labrador Current weakens - Gulf Stream north wall shifts North NAO - - Reduced production of LSW and weakening of DWBC - Labrador Current intensifies - Gulf Stream north wall shifts South
The Winter NAO Index 4 2 0 -2 -4 1860 1880 1900 1920 1940 1960 1980 2000
Feb.98 Jan.98 Sep.97 Oct.97 Feb.98 Mar.98 Progress of LSSW along Continental Margin
January April May September October November Intrusions of LSSW into Gulf of Maine
January The ‘98 Event
April The ‘98 Event
May The ‘98 Event
September The ‘98 Event
October The ‘98 Event
November The ‘98 Event
Complex Linkages Climate Physical Oceanography Calanus
NW Atlantic’s Coupled Slope Water System Maximum Modal State - Associated with NAO + Minimum Modal State - Associated with NAO -
NAO Index 3 0 -3 RSW Temp. Index 4 0 -4 1950 1960 1970 1980 1990 2000 Time Series of the NAO Index and the Regional Slope Water Temperature Index Slope-Water Sectors Time-Series Data
Cross-Correlation Relationship, Lag=1 0.8 4 0.4 0 r RSWT Index 0 -4 -0.4 -0.8 -6 -8 -4 0 4 8 -6 -4 -2 0 2 4 6 Lag (yr) NAO Coupled Slope Water System and the NAO • RSWT changes 1 yr after NAO. R2=0.31
Predicting the Response of the Coupled Slope Water System to the NAO Forecasting Hindcasting Predicted RSWT Index for 2000-2003 Observed and Predicted Time Series of the RSWT Index for 1958-1999
Continuous Plankton Recorder (CPR) Survey of the North Atlantic • SAHFOS supervises CPR surveys • throughout most of North Atlantic. • Sister CPR surveys on Scotian Shelf • and Gulf of Maine provide comparable • plankton time-series data. • Gulf of Maine CPR surveys are • conducted by NMFS in Narragansett, RI.
NAO Index Regional Slope Water Temperature Index C. finmarchicus Abundance Index Time Series of the NAO Index, the Regional Slope Water Temperature Index, and the C. finmarchicus Abundance Index
Calanus and the Coupled Slope Water System • Calanus changes 3 yrs after RSWT R2=0.25 Relationship, Lag=3 Cross-Correlation 0.8 1 0.4 r Calanus 0 0 -0.4 1998 -1 -0.8 -8 -4 0 4 8 -6 -4 -2 0 2 4 6 Lag (yr) RSWT Index