Tree and Vine Biomass Study in Rohden Forest, Brazil
Research on pre-harvest biomass estimation of trees and vines in Rohden Forest, Mato Grosso, Brazil, for sustainable logging practices.

Tree and Vine Biomass Study in Rohden Forest, Brazil
E N D
Presentation Transcript
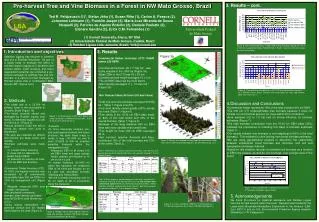
Figure 5: Tree and vine biomass in 200-1100 m long transects totaling 11.1 ha in a 1000 ha management block, Rohden Forest, Brazil. Columns with zero values for vines had no data. Figure 3a. a. b. Figure 6: Tree and vine stem density in 200-1100 m long transects totaling 11.1 ha in Rohden Forest, Brazil. Columns with zero values for vines had no data. Note: vine values x0.1 Table 1: Mean biomass, percent biomass of the total, stem density, and percent density of the total by DBH class for transects totaling 11.1 ha in Rohden Forest. 3b. Figure 3: Contour and shaded surface maps for commercial timber trees ≥30 cm DBH a) biomass [Mg ha-1], b) stem density [no. ha-1]. Table 2: Mean biomass, percent biomass of the total, stem density, and percent density of the total by DBH class for two common non-commercial species Amescla (Trattinickia burserifolia (Mart.) Willd.) and Breu (Protium heptaphyllum (Aubl.) March.), both Burseraceae, for transects totaling 11.1 ha in Rohden Forest. Figure 7: Area sampled versus biomass estimate for 17 transects in Rohden Forest, Brazil. Figure 2: Rohden forest (red) and the 1000 ha study site (yellow), Juruena, MT Brazil (image source Salatiel Alves de Araujo) Pre-harvest Tree and Vine Biomass in a Forest in NW Mato Grosso, Brazil Ted R. Feldpausch (1)*, Stefan Jirka (1), Susan Riha (1), Carlos A. Passos (2), Johannes Lehmann (1), Franklin Jasper (3), Maria Jose Miranda de Souza Noquelli (2), Pericles de Aquino Botelho (2), Daniela Pauletto (2), Elenara Gandini (2), Erick C.M. Fernandes (1) (1) Cornell University, Ithaca, NY USA (2) Universidade Federal de Mato Grosso, Cuiabá, Brazil (3) Rohden Lignea Ltda, Juruena, Brazil; *trf2@cornell.edu 3. Results – cont. Universidade Federal de Mato Grosso 1. Introduction and objectives 3. Results Selective logging has become a common land-use in Brazilian Amazônia. As part of a larger study to evaluate the effect of reduced impact logging on C dynamics and nutrient stocks, forest structure, and forest regeneration potential, we conducted a pre-harvest campaign to estimate tree and vine biomass in a parcel of forest managed by Rohden Lignea Ltda in northwestern Mato Grosso (MT) (Figure 1a,b). • Commercial timber inventory (CTI) (16600 stems ≥30 DBH) • Commercial biomass, 48 ± 77 Mg ha-1, was highly variable in the 1000 ha (Figure 3a). • Mean DBH of the CTI was 59 ± 24 cm. • Commercial bole height averaged 13 ± 3 m. • The 50 DBH class had the most stems. • Stem density averaged 11 ± 12 stem ha-1 (Figure 3b). • 1km Transect data (all trees ≥10 and vines) • Total tree and vine biomass averaged 319 Mg ha-1 (Table 1; Figure 4 and 5). • Vine stem density varied greatly (40%) across the forest (Table 1; Figure 6). • Tree stems in the 10-30 cm DBH class made up 84% of the total stems and 32% of the overall biomass (Table 1; Figure 6). • Biomass of the large diameter ≥60 cm DBH trees was more variable than small trees. • Tree height for trees ≥60 cm DBH averaged 33 m. • Two common species, Amescla and Breu, contributed 16% of the total biomass and 37% of the stems (Table 2). • 2. Methods • The study site is a 25,000 ha primary forest in the municipality of Juruena, Brazil (Figure 1b). • The forest, privately owned and managed by Rohden Lignea Ltda forest, is selectively logged at a rate of 1000 ha yr-1 (Figure 2). • Annual rainfall is 2,200 mm with a strong dry season from June to September. • The soils are classified as Ultisols and Oxisols, are deep, acidic, and infertile. • Biomass estimates were made from: • 1) a forest timber inventory of trees ≥30 cm diameter at breast height (DBH). • 2) transects to inventory all trees ≥ 10 cm DBH and all vines. • Commercial Timber Inventory (CTI) • A 100% pre-logging inventory was conducted for all commercially harvestable trees ≥30 cm DBH in a 1000 ha management unit (Figure 2). • Mapped, measured DBH, bole height, and species. • We calculated commercial biomass, stem density, and basal area for 50x50 m cells (Brown eq. 3.2.3). • Using kriging interpolation, we generate contour and 3D shaded relief maps for the area (Figure 3). • 4.Discussion and Conclusions • Commercial timber represents 16% of the total biomass ≥10 cm DBH. • The ≥30 cm CTI underestimates tree biomass because it does not include non-commercial species nor trees within 50 m of streams. • Area sampled (0.2 to 1.2 ha) had no strong influence on biomass estimates (Figure 7). • The high biomass contribution from the 10-30 cm DBH class (32%) indicates the importance of including this class in biomass estimates (Table 1). • Our results indicate vine biomass is not insignificant (4.6% of the total biomass). This estimate is often lacking from forest biomass estimates. • We are using geostatistical analysis to determine the relationship between undisturbed forest biomass and structure, and soil and topographic landscape features. • Based on this analysis, we plan to estimate tree biomass as a function of DBH size classes, as well as vine biomass, over a larger area of the forest. Figure 1: a) forest cover in MT state, Brazil and study site location in NW Mato Grosso (MT), Brazil (S 10 25’ 29.7; W 58 45’ 34.9). • Transects • To more intensively compare pre- and post-logging biomass and forest structure, we used these maps to locate 9 long (10x1000 m) and 8 short (10x200 to 500 m) stratified sampling transects within the management units • Measured DBH of all stems ≥10 cm DBH, lower and upper canopy height, species, and location to 10 cm on an x-y grid. • In nested transects (2x1000 m) within the transects we measured DBH of all vines and location on an x-y grid and calculated biomass (Gerwing and Farias 2000). • We are currently measuring soils to 60 cm depth at 25 m increments along the transects. 5. Acknowledgements We thank Pro-natura for logistical assistance and Rohden Lignea Industria for field support within the forest. Research was funded by the Large-scale Biosphere-Atmosphere Experiment in the Amazon (LBA-Eco) (ND-11) and an U.S. Environmental Protection Agency research fellowship to T.R. Feldpausch. Figure 4: a) Vines contribute 15 Mg ha-1 to forest biomass, 2) DBH measurements for all trees ≥10 DBH (304 Mg ha-1).