Download
1 / 87
980 likes | 1.47k Vues
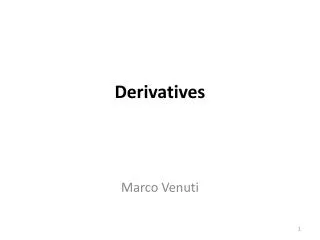
ENERGY DERIVATIVES. Econ 3385 – Economics of Energy S. G ürcan Gülen, Ph.D. Cash Markets Conduct Normal Business Activity Face Risks. Price Risk Management Using Derivatives. Organized Exchanges Futures - Options - Swaps. Forwards Options - Swaps. OTC. Markets. Price

E N D
ENERGY DERIVATIVES Econ 3385 – Economics of Energy S. Gürcan Gülen, Ph.D.
Cash Markets Conduct Normal Business Activity Face Risks Price Risk Management Using Derivatives Organized Exchanges Futures - Options - Swaps Forwards Options - Swaps OTC
Markets • Price • an indicator of the relative balance between the supply of and the demand for a particular product or commodity. • Commodity • a product over which the producer has lost control of the price. • Derivative • a product whose price is derived from the price of something else, which is referred to as the underlying commodity.
Markets • Spot Market • Immediate Physical Delivery • and immediate payment • Derivative Markets • Deferred Physical Delivery • Financially Settled Arrangements • Economic Purpose • Hedging • Price discovery
Risk and Risk Management: Strategic Implications What is risk management? Active identification and unbundling of the risks (exposures) a company faces in order to profit from exposures a company is well equipped to handle and mitigate potential losses from other risks. What is strategic risk management? Use of risk management to alter fundamentally a company’s equity valuation through optimizing capital structure, enhancing risk/return profile of company’s businesses and facilitating profitable pursuit of new opportunities. Derivatives A set of tools- forwards, futures, options, swaps and enhanced vehicles - that allow management to keep and add to those risks it seeks, and to shed those risks it chooses not to bear. These tools, which are traded in financial markets, allow management to focus on its core competencies in pursuit of its principal goal - maximizing returns while minimizing the variance of those returns. They are only part of the risk management tool set, along with operational efficiencies, competitive strategy, and so on.
Markets Requisites for a Futures Market Characteristics of the underlying cash commodity • Price Volatility • Active market • Open market (no government controls)
Price Theory Forward Curve The price of a commodity over time. Two different shapes: • Contango • Backwardated
Price Theory Futures v. Cash Prices If the futures price is greater than the cash price, then: Futures Price = Cash Price + Storage
Price Theory Contango Price time • Forward prices are successively higher over time • Today’s price is the lowest • Current supply exceeds demand
Price Theory Futures v. Cash Prices If the cash price is greater than the futures price, then: Futures Price = Cash Price + Storage - Convenience Yield
Price Theory Backwardation Price time Forward prices are successively lower over time • Today’s price is the highest • Current demand exceeds supply
NYMEX Organization 816 seats, 749 individual members NYMEX Membership Board of Directors Executive committee COMEX Membership 772 seats, 663 individual members Chairmen of the Board President Planning & development Compliance Clearing Market Surveillance Trade Surveillance Financial surveillance Strategic Planning Banking & Delveries Position processing Marketing Research
Futures Exchange • Characteristics: • Liquidity • Safety • Flexibility • Ingenuity
Futures Exchange Forward A bilateral commitment to buy or sell an agreed upon asset for a predetermined price on a specific future date. Futures A standardized forward contract which is traded on an organized futures exchange.
Futures Exchange Standard Contract Terms • Size • Quality • Point of Delivery • Time of Delivery • Payment • Disputes
Futures Exchange Variable Contract Terms • Price • Number of contracts orders • Delivery Month
Futures Exchange Rules of Operation • Times and days of business • Position limits • Daily price limits • Margin requirements • Delivery procedures • Payment • Disputes
97%-98% OF ALL FUTURES ARE NOT DELIVERED in other words: ONLY 2%-3% OF THE CONTRACTS TRADED ARE DELIVERED! EXAMPLE: IN 1990: 719,000 CRUDE OIL NYMEX CONTRACTS WERE ACTUALLY DELIVERED OUT OF 23 MILLION: ABOUT 3.126% QUESTION: WHAT DOES THIS MEAN? ACTIVITIES IN THE FUTURES MARKETS ARE MOSTLY FOR PURPOSES OTHER THAN PURCHASE AND SALE OF COMMODITY: FINANCIAL GOALS AND RISK MANAGEMENT GOALS.
QUESTION: HOW IS IT POSSIBLE FOR 98% OF EXISTING CONTRACTS TO DISAPPEAR? ANSWER: THE CLEARINGHOUSE REGULATION AND ACCOUNTING METHODS. THE CLEARINGHOUSE A NON-PROFIT MEMBERSHIP CLUB. THE CLEARINGHOUSE IS THE OMNIPOTENT GUARANTOR OF ALL CONTRACTS. * CLEARINGHOUSE GURANTEE: TO THE LONG - NO DEFAULT ON THE SELLING SIDE. TO THE SHORT - NO DEFAULT ON THE BUYING SIDE. * THE CLEARINGHOUSE DOES NOT GURANTEE THE MARKET ! * THE CLEARINGHOUSE NEVER TAKES A POSITION. * THE CLEARINGHOUSE MAKES SURE THAT ALL TRADES MATCH. I.E., THAT ALL THE POSITIONS MUST ADD UP TO ZERO EVERY TRADING DAY.
Clearinghouse Exchange Corporation Futures Commission Merchants (FCMs) Exchange Members Clearing Members Nonclearing Members FCM Customers
Futures Exchange Types of Positions • Long - a commitment to buy; benefits if prices rise • Short - a commitment to sell; benefits if prices fall
Buyer Seller Member Firm Member Firm Buying Floor Broker Selling Floor Broker Trading Ring Orders executed by open outcry by buying and selling floor brokers, recorded and placed on ticker Buying: floor broker confirms purchase Selling: floor broker confirms sale Member firm Reports purchase Reports sale Member firm Confirms purchase Confirms sale Clearinghouse 1 obligation long 1 obligation short Buyer now long 1 contract Seller now short 1 contract Total open interest: 1 contract
Seller - long with obligation to pay for and take delivery Buyer - short with obligation to deliver Member Firm Member Firm Selling Floor Broker Buying Floor Broker Trading Ring Orders executed by open outcry by buying and selling floor brokers, recorded and placed on ticker Selling floor broker confirms purchase Buying floor broker confirms sale Member firm Reports sale Reports purchase Member firm Confirms sale Confirms purchase Clearinghouse 1 Obligation or short purchased canceling sell obligation 1 Obligation or long sold canceling buy obligation Buyer has offset obligation by sale – no market position Seller has offset obligation by purchase - no market position Total open interest: 0 contract
Futures Exchange Delivery Procedure Short Long Intention to Accept Delivery Intention to Make delivery Clearinghouse Matches Seller with Buyer Delivery Seller Buyer Payment Deposits margin Deposits full margin Clearing Broker Clearing Broker
Futures Exchange Margins • Initial Margin A cash deposit • Variation Margin A margin call
Outside Customers ... A B C D ... E Customer margins FCM b FCM c FCM a Clearing member 1 Clearing member 2 Clearing margins Clearinghouse B Clearinghouse A
Futures Exchange Initial Margin Requirements NYMEX $/Contract Crude Oil 2,200 Heating Oil 2,000 Gasoline 2,000 Natural Gas 6,300 * / 4,000 Electricity 1,900 + Effective January 7, 1997 * for the Feb and Mar contracts only
Futures Exchange • Marking-to Market • The process that realizes all • gains and losses. • Settlement Price • The benchmark against which all • accounts are marked-to-market.
Futures Exchange Marking-to-Market Example: Transaction Settlement Commodity Price PriceChange Gasoline 64.00 65.50 1.50+ Heating Oil 58.00 56.00 2.00+ Gasoline 66.00 65.50 0.50- Crude Light 25.60 25.50 0.10- Electricity 21.00 19.90 1.10+
JUNE WTI FUTURES (1,000 bbls PER CONTRACT) DATEPARTYNUM PRICEPARTYNUMPRICEOI* Th.5.16 A:LONG 10 $20 CH B:SHORT 10 $20 10 5.16 C:LONG 25 $21 CH D:SHORT 25 $21 35 5.16 SETTLE $21 $21 Fr.5.17 E:LONG 10 $22 CH A:SHORT 10 $22 35 5.17 SETTLE $22 $22 Mo.5.20 D:LONG 25 $22.5 CH F:SHORT 25 $22.5 35 5.20 B:LONG 10 $21.5 CH C:SHORT 10 $21.5 25 5.20 SETTLE $21.5 $21.5 Tu.5.21 F:LONG 10 $21 CH E:SHORT 10 $21 15 5.21 SETTLE $21 $21 We.5.22 F:LONG 10 $20 CH C:SHORT 10 $20 5 5.22 SETTLE $20 $20 * OI = Open Interest
CLEARINGHOUSE ACCOUNTING A: LONG 10; SHORT 10 : OUT B: SHORT 10; LONG 10 : OUT C: LONG 25; SHORT 10; SHORT 10 C remains LONG 5. D: SHORT 25; LONG 25 : OUT E: LONG 10; SHORT 10 : OUT F: SHORT 25; LONG 10 : LONG 10 F remains SHORT 5. 5.23 F DECIDES TO DELIVER 5 FUTURES C ACCEPTS DELIVERY OF 5 CONTRACTS. The actual delivery is now scheduled for June 23.
CLEARINGHOUSE PROFIT/LOSS = ZERO* LONGPRICESHORTPRICETOTAL PROFIT A 10 $20 10 $22 $20,000 B 10 $21.5 10 $20 -$15,000 C 10 $21 10 $21.5 $5,000 10 $20 -$10,000 D 25 $22.5 25 $21 -$37,500 E 10 $22 10 $21 -$10,000 F 10 $21 25 $22.5 $15,000 10 $20 $25,000 TOTAL -$7,500 C TAKES DELIVERY 5 PAYS $21 : -$105,000 F DELIVERS 5 RECEIVES $22.5 : $112,500 $7,500 TOTAL 0 * This calculation accounts for buying and selling only. It does not account for cash movements resulting from the daily marking-to-market process.
The following exhibits illustrate the activity in the margin account of each of the traders focusing only on cash flow resulting from the daily marking-to-market process. Thus, possible margin calls are ignored. PARTYA: DATEACTIONPRICESETTLECASH FLOWPOSITION 5.16 LONG 10 $20 Initial margin LONG 10 $21 +$10,000 LONG 10 5.17 SHORT 10 $22 +$10,000 0 TOTAL $20,000 A’s profit is = $20,000 PARTYB: DATEACTIONPRICESETTLECASH FLOWPOSITION 5.16 SHORT 10 $20 Initial margin SHORT 10 $21 -$10,000 SHORT 10 5.17 $22 -$10,000 SHORT 10 5.20 LONG 10 $21.5 +$5,000 0 TOTAL -$15,000 B’s loss is = $15,000
PARTYC: DATEACTIONPRICESETTLECASH FLOWPOSITION 5.16 LONG 25 $21 $21 Initial margin LONG 25 5.17 $22 +$25,000 5.20 SHORT 10 $21.5 -$5,000 $21.5 -$7,500 LONG 15 5.21 $20.5 -$15,000 LONG 15 5.22 SHORT 10 $20 -$5,000 $20 -$2,500 LONG 5 5.23 TAKE DELIVERY OF 5,000 BARRELS for $20/bbl -$100,000 0 C’s total loss up to and and including 5.22 is $10,000. Note that the 5 contracts that were delivered has accumulated the following amount over the period: 5.17 (5,000)($1) = $5,000 5.20 (5,000)(-$.5) = -$2,500 5.21 (5,000)(-$1) = -$5,000 5.22 (5,000)(-$.5) = -$2,500 5.23 (5,000)(-$20) = -$100,000 Payment upon delivery TOTAL………….-$105,000 The five contracts have accumulated total payment of $105,000 (Note: $105,000/5,000 = $21/bbl).
PARTYD: DATEACTIONPRICESETTLECASH FLOWPOSITION 5.16 SHORT 25 $21 Initial margin SHORT 25 $21 0 SHORT 25 5.17 $22 -$25,000 SHORT 25 5.20 LONG 25 $22.5 -$12,500 0 TOTAL -$37,500 D’s total loss is = $37,500 PARTYE: DATEACTIONPRICESETTLECASH FLOWPOSITION 5.17 LONG 10 $22 Initial margin LONG 10 $22 0 LONG 10 5.20 $21.5 -$5,000 LONG 10 5.21 SHORT 10 $21 -$5,000 0 TOTAL -$10,000 E’s total loss is = $10,000