Download
1 / 24
240 likes | 335 Vues
Analysis of Latino voter participation based on US Census data and scholarly research from Pew and US Hispanic Leadership Institute.

E N D
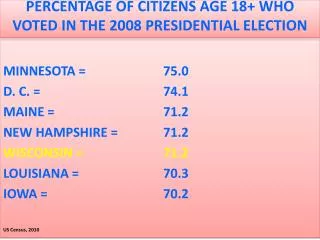
PERCENTAGE OF CITIZENS AGE 18+ WHO VOTED IN THE 2008 PRESIDENTIAL ELECTION MINNESOTA = 75.0 D. C. = 74.1 MAINE = 71.2 NEW HAMPSHIRE = 71.2 WISCONSIN = 71.2 LOUISIANA = 70.3 IOWA = 70.2 US Census, 2010
PERCENTAGE OF CITIZENS AGE 18+ WHO VOTED IN THE 2008 PRESIDENTIAL ELECTION MISSISSIPPI = 69.7 VIRGINIA = 68.7 COLORADO = 68.4 MARYLAND = 68.3 MICHIGAN = 67.8 SOUTH DAKOTA = 67.8 OREGON = 67.6 NORTH CAROLINA = 67.5 NORTH DAKOTA = 67.5 RHODE ISLAND = 67.4 DELAWARE = 67.3 NEBRASKA = 67.3 CONNECTICUTT = 67.2 MASSACHUSETTS = 67.1 WASHINGTON = 66.8 US Census, 2010
PERCENTAGE OF CITIZENS AGE 18+ WHO VOTED IN THE 2008 PRESIDENTIAL ELECTION MISSOURI = 65.8 SOUTH CAROLINA = 65.6 OHIO = 65.5 MONTANA = 65.4 ALASKA = 65.0 VERMONT = 64.7 STATE AVERAGE = 64.5 US Census, 2010
PERCENTAGE OF CITIZENS AGE 18+ WHO VOTED IN THE 2008 PRESIDENTIAL ELECTION WYOMING = 64.3 GEORGIA = 64.2 NEW JERSEY = 64.1 FLORIDA = 63.8 CALIFORNIA = 63.4 KANSAS = 63.3 KENTUCKY = 63.1 ILLINOIS = 62.6 NEW MEXICO = 62.6 ALABAMA = 62.4 PENNSYLVANIA = 62.4 IDAHO = 61.4 INDIANA = 60.5 US Census, 2010
PERCENTAGE OF CITIZENS AGE 18+ WHO VOTED IN THE 2008 PRESIDENTIAL ELECTION ARIZONA = 59.9 NEVADA = 59.9 NEW YORK = 58.8 OKLAHOMA = 58.7 TEXAS = 56.1 TENNESSEEE = 55.5 ARKANSAS = 53.8 WEST VIRGINIA = 53.4 UTAH = 53.1 HAWAII = 51.8 US Census, 2010
Growth in Latino Voters ”Every month about 50,000 Latino citizens turn 18 and become eligible to vote and the majority of them vote democratic.” Latino Decisions, Sylvia Monzamo, 2012
Latinos, 2012 Election An estimated 119[131 in ’08] million Americans turned out to vote… Source: US Hispanic Leadership Institute, USHLI, November 11, 2012.
Growth in Latino Voters ”…in 1976, 88 percent of voters were white…in 2008 the number was 74 percent...It’s estimated that it will be 72 percent in 2012.” Pew Research Center, 2012
Growth in Latino Voters ”In terms of voter turnout, we project that 52.7 percent [+/-0.6] of eligible Hispanics will vote in the upcoming election, and increase from 49.9% in 2008 and a continuation of the past decade’s long upward trend.” Camarota, S.A., & Zeigler, K., “Projecting the 2012 Hispanic Vote, August 2012
Growth in Latino Voters ”The projected Hispanic voted participation rate of 52.7% compares to 66.1% for non-Hispanic whites and 65.2 for non-Hispanic blacks in 2008.” Camarota, S.A., & Zeigler, K., “Projecting the 2012 Hispanic Vote, August 2012
Latinos, 2012 Election, millions --Under 18 = 17.6 --Adult unauthorized = 7.1……….24.7 --Adult permanent legal resident = 5.4……….30.1 --Eligible, but Did NOT vote = 11.2……....41.2 --Voters =12.5………53.7 Source: Pew Hispanic Center, November 14, 2012.
Latinos, 2012 Election “Obama won 71% of the Hispanic vote while Mitt Romney won 27%. The gap of 44%-pts. was even greater than Mr. Obama’s 36-pt. advantage over John McCain in 2008”. Source: New York Times, November 11, 2012.
Latinos, 2012 Election NY = 89% IL = 81% PA = 80% CT = 79% CO = 75%.....14% [13%] of the electorate CA = 72% NV = 71%.....18% [15%] of the electorate WI = 66% NM = 65% FL = 60%.....17% [14%] of electorate Source: New York Times, November 10, 2012 and Pew Hispanic Center, November 7, 2012.
Growth in Latino Voters ”The Latino vote is more influential in the presidential election than it is in overall American politics….About half the states in play have a Latino population big enough to make the difference.” Rosenberg, Simon, New Democratic Network, 2012
Latinos, 2012 Election --Latinas represented 6% of total vote and 76% voted for Obama --Latinos represented 5% of total vote% and 65% voted for Obama Source: CBSNews, exit polls, November 8, 2012.
Latinos, 2012 Election “In Arizona…the number of Latinos on early-voting lists rose substantially , to 225,000 this year from 96,000 in 2008, said Petra Falcon, director of Promise Arizona…”. Source: New York Times, November 11, 2012.
Growth in Latino Voters ”A Republican probably can’t win without about 40 percent, minimum, of the Latino vote.” Sabato, Larry, Director, Univ. of Virginia’s Center for Politics, 2012