Analysis of Viral Gene Outliers in Host or Subtype Groups
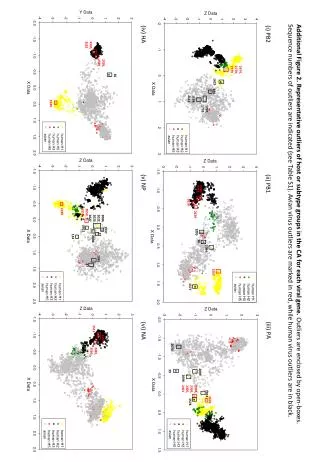
This study presents an in-depth analysis of representative outliers of host or subtype groups in the context of various viral genes. Outliers are highlighted within open boxes, with their sequence numbers provided in Table S1 for reference. Notably, avian virus outliers are indicated in red, while human virus outliers are marked in black. Such differentiation allows for an easier interpretation of data and understanding of how different viruses may interact with host organisms, contributing to virology research and potential therapeutic developments.

Analysis of Viral Gene Outliers in Host or Subtype Groups
E N D
Presentation Transcript
(iii) PA (i) PB2 (ii) PB1 65 2474, 2778, 2779 1937 2598, 2599 2004, 2022, 2023, 2027 3449 37 1967 2481, 2560 3513 2006 3330, 3262 2650, 3310 47 1623 3363 2633 2021 2054 490 2094 (iii) PA 2099 1792, 1793 134 2785 36 2398, 2399, 2400, 2401 2718 2095 2429 1578 2549 1577 2610 1154, 2111 2098 2340 2070 39 (iv) HA (v) NP (vi) NA Additional Figure 2. Representative outliers of host or subtype groups in the CA for each viral gene. Outliers are enclosed by open-boxes. Sequence numbers of outliers are indicated (see Table S1). Avian virus outliers are marked in red, while human virus outliers are in black.