Download
1 / 15
190 likes | 627 Vues
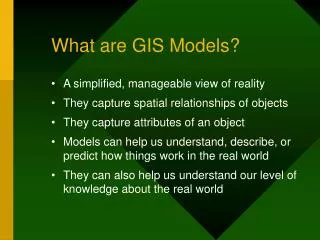
Retail Gravity Models and GIS. Jonathan Dorwart GIS Analyst / Planner Wikstrom Planning and Economic Consultants April 5, 2007. Retail Gravity Models and GIS. Typical market analysis estimates competitive position on the basis of trade areas…. 5 min. 10 min. 15 min. Travel time….

E N D
Retail Gravity Models and GIS Jonathan Dorwart GIS Analyst / Planner Wikstrom Planning and Economic Consultants April 5, 2007
Typical market analysis estimates competitive position on the basis of trade areas… 5 min. 10 min. 15 min. Travel time… Fixed radii and breakpoints… Sales data from individuals…
Why develop a gravity model in GIS to model retail competition? • Better model the impacts of competition when customer datanot available (basis of trade area has to do with character of development) • Additional information for making zoning decisions ordetermining optimum amount of retail in a proposed development • Allows a “pro forma” determination of the suitability of retail on a site in a given market • Pedagogic in the sense that it lets you visualize competition and opportunities • Data availability: Census, local area population projections, sales tax and land use data (including competing retail) readily available
Building the Model • Identify problem • Conceptualize main ingredients/symbolize • Utility = Size/Distance • Operationalize – Define variables • Test (observed v. predicted) • Herein lies the problem • Evaluation • How to use results: Advantages vs. Disadvantages
Conceptual Basis • Idealization of consumer behavior • In absence of empirical data to articulate consumer decision-making process three naïve assumptions are made: • Psychological trade off between size and distance • This tradeoff can be generalized across a number of competing sites (all other things being equal) • Little consideration of scale or regional context (Original Reilly model was built as an analogy of regional patterns between cities in Texas) • Is the model well-specified???
Variations on the Gravity Model Newton (1687) Reilly (1931) “Social physics” Huff (1964)“Probability” Estimating the friction of distance using multiple linear regression… Gravity model’s multiplicative nature allows log linear form to be taken, which can be regressed upon.
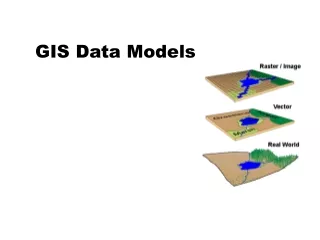
Implementation • Our model is based on Huff’s and integrated into a raster based data model in GIS using map algebra • Total gravity surface derived and then a specific gravity (capture rate) calculated for site in question • The total number of consumers captured are determined by population density. • Distance can be measured as a crow flies, along a transportation network or in terms of estimated travel time.
Implementation • Large number of calculations (retail sites) requires scripting in either Python/VBA • GIS software is similar to Lego blocks • Utilize existing data on transportation network to arrive at travel times as a proxy for distance (not always current) • Testing/Calibration? Well now, that is a good question…how much do travel time/distance and size of retail establish influence consumers? • OUR PROBLEM IS WE HAVE NO OBSERVATIONS!!!
Implementation • How can consumer buying power be estimated from this model? • Per capita spending determined from state sales tax receipts • What is the relationship of consumer buying power to store size? • Amount of available buying power can be translated in to gross leasable area of a store • How does this relate to the site? • FAR, parking requirements, setbacks, building height…
For the sake of simplicity many stores were aggregated into shopping centers/areas. Strip nature of retail development and point based representation used in gravity model is problematic.
This is an example of a simplified dasymetric map –current urban land use constrains population density
Value of Model and Lessons Learned • Model is pedagogic – One (flexible) step in decision-making process • Decisions are political in nature (within community/firm) • Always tension between theory and empiricism: • This model is challenged by lack of hypothetical deductive spiral(i.e.. no observations to test) • However, difficulties in operationalizing development process • in retail sector are great • Minimum of three year development process – this is not a • laboratory • Lack of access to consumer behavior data. Why? • See Birken in GIS, Spatial Analysis, and Modeling • Community politics in entitlement process • Other factors – Land use is fragmented, consumer confidence changes, capital markets, etc. • Question is what information is useful in a given situation. Sometimes simple models provide good initial guidance.