Download
1 / 27
310 likes | 573 Vues
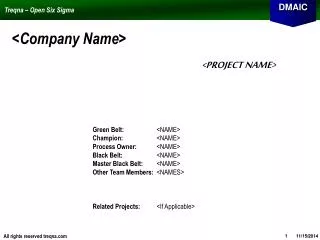
Project Title Black Belt or Green Belt Name. Project Number Facility/Location. Step 1 - Team Members and Roles. Include with this slide (No Exceptions) :

E N D
Project TitleBlack Belt or Green Belt Name Project Number Facility/Location Assisting Organizations Reach the Next Level of Excellence and Profitability – 805-494-0378 – carlos@mculture.net - www.linkedin.com/in/carlosconejocssbb
Step 1 - Team Members and Roles • Include with this slide (No Exceptions): • Process Owner: (Not just a name, the person responsible for the process and whom has ownership. The Black Belt or Green Belt can not be the Process owner for their own project) The Process Owner must have the authority for implementation and on-going controls. • Black Belt Mentor(If Green Belt): • Project Champion: • Financial Analyst: (Facility Controller) • Team Members: List team member name, position and role on team • Also include in project binder(or electronically): Monthly calendar identifying meeting dates Meeting minutes from each meeting attached to calendar
Step 1(continued) - Project Timeline • Include in timeline(No Exceptions): • Project start date • Project Milestones • Project End (Tie project end date to dated closure documentation) Note: This should be added at the beginning of the project. A timeline is established at the beginning of a project to forecast timing, all timelines are to include an expected completion date to plant goals. Programs, other than Microsoft Project, can be used to create the timeline.
Step 1(continued) - Process Map • Include on the Process Map(No exceptions): • Process map must follow ALL 7 steps: • Define the scope of process • Document all tasks or operations needed in the production of a “good” product or service (How the process is today) • Document each task or operation as “Value Added” (“VA”) or “Non-value Added” (“NVA”). • List the internal and external Y’s at each process step • List the internal and external X’s at each process step • Classify all X’s as one or more of the following: • Controllable (C) • Standard Operating Procedure (SOP) • Noise (N) • Clearly identify all data collection points 6
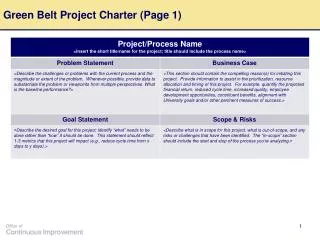
Step 1, 2 & 5 - Project Definition Page Note: This page should be continually updated over the duration of the project. Problem Statement: What is the customer’s defect/dissatisfier with product/process/service received? Nb: This will require redrafting based on data gathered. (eg. Scrap; Pareto top issues, initial sampling plan data review, etc) Customer(s): List External or Internal customers or both CT’s: (Ideal Process, Product, Service) CTD: CTQ: CTC: Defect Definition: Unit of customer nonconformance. (Nb: separate unrelated defects = 2 projects) Project Objective: 1) Identify major causes of nonconformance(s). 2) Identify optimal outcome of the project at its conclusion • Capability: • Current: Zst= DPU • Goal: Zst= DPU • Stretch Goal: Zst = DPU • Benefits: • CTD = reduced WIP, Inventory etc. • CTQ = Product performs/meets expectations • CTC = Reduce rework/replacement cost • Financial Benefit (If any) • To Do’s: (Initial) • Develop Problem Definition Scope • Identify focused team and customer members • Develop process map w/data collection points • Establish reliable Measurement for baseline data collection. Validate MSA • Conduct Process Capability • Develop representative sampling plan and collect baseline data for Metric reporting • Evaluate data: Pareto, Multi-vari, Z transform etc. What are the expectations of the customer for delivery, quality and cost?
Step 1 - Identify Variation Sources • Include for Step 1(No exceptions): • Brainstorming Tools (e.g.: Fishbone diagram, FMEA, Process Flow Diagram) • Cause & Effects Matrix • Cause & Effects Matrix is to include all outputs and inputs identified in the Process Map and Brainstorming activity. Include entire matrix in presentation. • Pareto, at minimum, the Top 5-10 ranked inputs from the matrix and include in presentation. • When the C&E matrix is completed early in the project, review and update as necessary as the Analyze phase is completed. • Note: The C & E Matrix is a primary tool used to reduce a large number of inputs to 5-10 inputs. A C & E Matrix will not be accepted unlessALL identified inputs and outputs are listed. 6
Step 6 (continued) - Identify Variation Sources Potential X Matrix Note: This matrix is a living document and should be updated when changes to the project are necessary. List all inputs identified for project Identify test/analysis method used (when applicable) Identify Yes or No if input is vital If hypothesis test is run, list the p-value For each input, list initial tool used to identify input
Step 2 - Performance Standards • Include for Performance Standards(No exceptions): • Define the Customer (Defect) Specification for the output being studied or the reason why the project is important. • List the origin of the specification (e.g.: Drawings, Customer requirements, etc.) • When working with attribute data and a quality characteristic, identify the threshold, method of attribute method and include photograph of the threshold when visual. • If specification is created, list the following: • Criteria used to establish specification • Parties involved in creating specification • Who approved the specification Note: The defect definition is identified on the Problem Definition page, this page is included as support for defining the specification. 6
Step 3 - Measurement Systems Analysis • Include for Measurement Systems Analysis (No exceptions): • Description of how the measurement system analysis is to be conducted for the project defect, this should link to the defect as described in Step 2. • Include details on how the study is performed (Study methodology). • Identify the number of parts/items used and number of trials • Identify operators/titles and relation to the project • Identify gages used for the study, gage calibration date, and expert if Attribute data. • Document specification used • Reference next slide for results requirements • If study fails: • Identify area for improvement • Document the improvement and actions • Document information listed above for new study • Re-run the Gage R&R • Document results per requirements on next slide Do Not use historic data as Baseline for the Project!! (Unless verified and approved by a Lead Black Belt) Must re-establish current state for the project. 6
Step 3 (continued) - Measurement Systems Analysis • Include for the Measurement Systems Analysis (No exceptions): • For Attribute data : • Completed using a minimum of 30 Samples • Clear identification of the threshold • A copy of the Minitab session window or Excel Workbook containing the study results • All Appraisers versus Standard clearly identified with a callout identifying the study as “Pass” or “Fail” • Detailed description of what the results mean and list next steps if applicable • Associated graphs for the study, which are to include the 95% confidence intervals 6
Step 3 (continued) - Measurement Systems Analysis • Include for the Measurement Systems Analysis (No exceptions): • For Continuous data: • Completed using a minimum of 10 samples. • A copy of the Minitab session window or Excel Workbook containing the study results. • Study Variation (5.15*s) clearly identified as acceptable or unacceptable. Acceptance criteria is less than 30%. • Percent Study Variation (%SV) clearly identified as acceptable or unacceptable. Acceptance criteria is less than 30%. • Clear identification of the number of distinct categories as acceptable or unacceptable. Acceptance criteria is equal to or greater than 5. • Detailed description of what the results mean and what are the next steps if applicable • Associated graphs for the study 6
Step 3 (continued) - Measurement Systems Analysis • Include for the Measurement Systems Analysis (No exceptions): • For Other methods: • Identify reason for using method • Identify verification method and number of samples. Examples of Other methods, but not limited to, include: • Correlation • Regression Analysis • Two Sample T-Test • Audit, etc. • Evaluation criteria - Identify for verification what is acceptable and unacceptable. Support response with explanation of results • Detailed description of what the results mean and list next steps if applicable • Associated graphs for the study when applicable 6
Step 4 - Process Capability • Include for Process Capability (No exceptions): • Note: Process capability only acceptable after successfully completing a Measurement Systems Analysis for the defect and is based on defect definition established on Problem Definition Page. • For Attribute data • Copy of Minitab Six Sigma Product report • Clearly identify the DPMO and the Zst Score using callouts • For Continuous data: • Check data for Normality - Include graph • If data is not normal, take appropriate steps to transform data (Reference Lead Black Belt for assistance as needed) • If data is normal, include a copy of Minitab Six Sigma Process report • Clearly identify the DPMO and the Zst score using callouts • Reminder - DPMO and Zst Score from process capability is used to establish “Current” on Problem Definition Page 6
Step 5 - Define Performance Objectives • Include for Defining Performance Objectives (No exceptions): • Current process capability - Zst and DPMO from Step 4 • Project Goal performance • Define the conditions for establishing the goal (e.g.: Customer request/demand, Plant Management, 90/50 Rule) • Project Stretch Goal performance • Define the conditions for establishing the goal (e.g.: Customer request/demand, Plant Management, 90/50 Rule) • Cross reference Step 11 - Determine Process Capability, to compare actual project improvement amount to projected project goals to verify we improved as planned. Note: The process performance and goals are identified on the Problem Definition page. The information is listed here as support to that page and to physically tie the project goals to the actual project improvement. 6
Step 6 (continued) - Identify Variation Sources • Include for Step 6 (No exceptions): • Data collection Plan • Identify data type (Per Defect Definition) • List measurement method (Must have completed MSA) • Identify rational subgroups • Create Subgroup tree (Reference example below) 6
Step 6 (continued) - Identify Variation Sources • Include for Step 6 (No exceptions): • Tools used to identify sources of variation for the defect identified in the problem statement. Examples of tools follow, but are not limited to: • For Attribute data: • Pareto Charts • Run Charts • Correlation Analysis • For Continuous data: • Multi-vari - Box Plots • Main Effects Plot - Run Charts • Pareto - Correlation Analysis • Potential X Matrix - Reference next slide Note: Step 6 does not provide statistical significance in reducing the number of inputs. Hypothesis testing is required to identify statistical significance. However, Correlation can be used to eliminate inputs if input has no variation and no correlation back to the defect. 6
Step 7 - Screen Potential Causes • Include for Step 7 (No exceptions): • Evidence of the investigation of each potential x (KPIV) • Evidence of the planning, explanation, data collection and result for each statistical test used to investigate each and every potential x (KPIV’s). • Include in presentation for tests: • Copy of the Minitab session window clearly titled • Brief description of what is being tested • List the Null and Alternate Hypothesis • Clearly identify the p-value • Describe in detail what the results mean (What is being accepted or rejected?) • Evidence in the form of documentation of updated potential x’s (KPIV’s) Note: Hypothesis testing is to relate to the problem definition, defect definition, process capability and data type. If using discrete nominal data, do not use continuous tools. Reference Hypothesis Test roadmap on following slide for appropriate test. 6
Step 8 - Discover Variable Relationships • Include for Step 8 (No exceptions when applicable): • Demonstration of the appropriate statistical tools to determine the optimum process for the KPIV’s validated in Step 7 • When DOE is conducted, include the following: • DOE Planning Sheet • Reduced model results from ANOVA table • Main Effects and Interactions plot (when applicable) • Initial settings, changed settings and final settings • Factors • Follow up Experiments, documentation and capability study • Verification of results • Describe in detail what the results mean • Define how much of the defect was explained by the DOE (error) 6
Step 9 - Establish Operating Tolerances • Identify either targets or tolerances for project KPIV as appropriate (No exceptions when applicable): • Targets: • A setting for a critical KPIV determined through the use Hypothesis Tests that will provide best results. Include method and setting. • Manufacturing Tolerances: • Manufacturing Tolerances are “operating ranges” set for critical KPIVs of a continuous nature where needed. Include method and settings. 6
Identify Improvement • Identify improvement(s) for project (No Exceptions): • For each improvement identified for and relating to the project include: • Detailed description of the improvement (Use photo’s or drawings as needed to properly convey area(s) of improvement. • Evidence that improvement is statistically significant (Hypothesis Test - Reference Step 7 and Step 8 for details) • Date of implementation • Gate Charts may be used to illustrate break points • Evidence of sustained improvement
Step 10 - Measurement Systems Analysis • Include for Measurement Systems Analysis (No exceptions): • Refer to Step 3 for study requirements • All appropriate documentation for project output • Concentrate on and include all appropriate documentation as identified in Step 3 for each KPIV • Refer to Lead Black Belt to Evaluate the Necessity of Repeating R&R if No Changes to the Part/Process/Operator has changed that would affect the outcome. (This is most often by passed on Attribute Gage R&R’s, that are performed on documentation.) Note: After any change it is important to revalidate the MSA as a change in the R&R may be realized. Without proof of the Measuring System at this step the data may not be trusted. 6
Step 11 - Process Capability • Include for Process Capability (No exceptions): • Note: Process capability only acceptable after successfully completing a Measurement Systems Analysis. For the project output, defect based on definition established on Problem Definition Page. For KPIV’s, study is based on data type of specific input. • For Attribute data: • Copy of Minitab Six Sigma Product report with Baseline and Post-Improvement data • Clearly identify the Baseline and Final DPMO and the Zst Score using callouts. Include % improvement for DPMO. • For Continuous data: • Copy of Minitab Six Sigma Process report • Clearly identify the Baseline and Final DPMO and the Zst score using callouts. Include % improvement for DPMO. • Conduct Process Capability on KPIV’s, document accordingly and include in presentation using criteria listed above, this is necessary to advance to the control phase. 6
Step 12 - Implement Process Control • Include for all forms of control for each critical KPIV (No Exceptions): • Clear description of all forms of control for each KPIV • When applied, include detailed description of poka-yoke, mechanical control and associated pictures or drawings • Clearly identify applicable control documentation, control charts and methods: • Standard Operating Procedures - Include SOP number, revision date, revision level, approval date, document owner and evidence of operator training • Checklist - Include document title, document owner, revision level, revision date, approval date, use frequency and evidence of user training • Audit procedure and requirements - Include document number, revision level, revision date, approval date, use frequency and evidence of user training • Control Plans - Include document number, document owner, Approval date and evidence of training/notification for process users • Reaction or Troubleshooting plan - Include document number, document owner, approval date and evidence of training/notification for process users • Training Guide and timing - Include documentation number, document owner, approval date, evidence of training, plan for training new or previously untrained personal and interval for retraining 6
Step 12 (continued) - Implement Process Control • Include for all forms of control for each critical KPIV (No Exceptions): • Evidence of a reaction plan if defect returns. A reaction plan should be developed with the team, published, and understood by all personnel that are responsible for the process. • Evidence of meeting the project objectives for DPMO within 10% (Tie improvement amount back to Step 5, the original project objective, for closure of the project and transfer to the natural Process Owner) • Evidence over time of the sustained reduction identified in the project • Evidence of what natural Process Owners actions are Note: Step 12 is critical in verifying that we are monitoring the project output and controlling the KPIV’s. 6
Project Checklist The Project List is to be used as a guide to assure each project contains all the information Required in order to properly close a project and receive approval. If you are unsure if a specific Element applies to your project, consult your Lead Black Belt. Define Phase: Deliverables: Supporting Documentation Sign Offs List of CTQ’s Plant Measurables/Data Team Selection Pareto Chart Process Map Team Roster Project Timeline Checklist Initial Financial Est. Meeting Minutes Problem Statement Objective Defect Definition Project Listed in Database Signed Off Project Authorization Form Measure Phase: Deliverables: Supporting DocumentationSign Offs Spec for Output Variable Proof/Validation of Spec for “Y” Successful Measurement System Analysis Gage R&R – Audit or Verification Plan Initial Process Capability Analysis Refined Problem Statement/Objective/Defect Definition Financial Statement Financial Summary Sheet Analyze Phase: Deliverables Supporting Documentation Sign Offs Identification of all Potential “X”’s Prioritization of X’s to Pursue Process Map Fishbone Diagram Cause and Effect Matrix Finalize List of KPIV’s with Statistically Significant Data Pareto Charts Multi-Vari Studies Regression Analysis ANOVA 6
Project Checklist (Continued) Improve Phase: Deliverables: Supporting Documentation: Sign Offs Optimum Operating Levels for KPIV’s Optimization DOE’s Validation of Output at Optimum Levels EVOP/PLEX Tolerances or Operating Ranges for KPIV’s RSM Successful MSA for Y’s and X’s Single Factor Trials w/Hy Process Capability for All KPIV’s (Key X’s) Gage R&R Final Process Capability Output Validation Data Control Phase: Deliverables: Supporting Documentation: Sign Offs Controls for each KPIV Updated Documents Control Plan and FMEA Updated Project Documentation Audit Complete Executive Summary Evidence of Transfer of Project to Natural Owner Reaction Plan Sign Off by Process Owner Final Team Meeting with Report Out Verification of Financials with Approval Update and Close Project in Database 6

![Six Sigma [Green Belt Project]](https://cdn4.slideserve.com/214188/slide1-dt.jpg)
![Six Sigma [Green Belt Project]](https://cdn0.slideserve.com/646243/six-sigma-green-belt-project-dt.jpg)


![Six Sigma [Green Belt Project]](https://cdn3.slideserve.com/5641173/six-sigma-green-belt-project-dt.jpg)


![Six Sigma [Green Belt Project]](https://cdn5.slideserve.com/9507141/six-sigma-green-belt-project-dt.jpg)