Statistical Analysis of Exam 1 Scores in MATH 101: Descriptive Statistics Overview
This document presents a detailed analysis of Exam 1 scores from MATH 101, focusing on descriptive statistics such as the total number of variables, mean, median, trimmed mean, standard deviation, and standard error of the mean. The scores range from a minimum of 39 to a maximum of 100, with quartiles Q1 and Q3 at 74 and 90, respectively. The findings assist in understanding the overall performance of students and identifying any potential trends or areas needing improvement.

Statistical Analysis of Exam 1 Scores in MATH 101: Descriptive Statistics Overview
E N D
Presentation Transcript
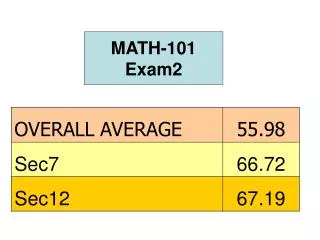
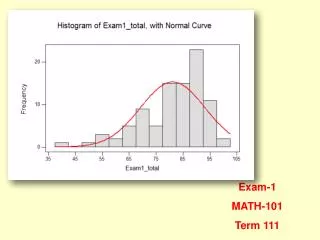
Exam-1 MATH-101 Term 111
Descriptive Statistics: Exam1_total Variable N Mean Median TrMeanStDev SE Mean Exam1_to 92 81.14 83.50 81.98 11.96 1.25 Variable Minimum Maximum Q1 Q3 Exam1_to 39.00 100.00 74.00 90.00