Download
1 / 79
1.12k likes | 2.06k Vues
Traffic Studies. TS4273 TRAFFIC ENGINEERING. Reasons To Collect Data. Managing the physical system (replaced, repaired, anticipated schedule) Investigating trends over time (forecast future transportation needs)

E N D
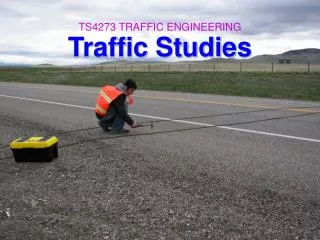
Traffic Studies TS4273 TRAFFIC ENGINEERING
Reasons To Collect Data • Managing the physical system (replaced, repaired, anticipated schedule) • Investigating trends over time (forecast future transportation needs) • Understanding the needs & choice of the public & industry (nature of travel demand)
Reasons To Collect Data[cont’d] • Calibrating basic relationships or parameters (perception-reaction time, discharge headways at a signalized intersection, headway & spacing relationship) • Assessing the effectiveness of improvements (before & after study)
Reasons To Collect Data[cont’d] • Assessing potential impacts (traffic impact assessment) • Evaluating facility or system performance (periodically studies to determine quantity and quality of accessibility and/or mobility service to the public)
Type Of Studies • Volume Studies (the most basic traffic studies) • Speed Studies (safety concern) • Travel-time Studies (measure quality of service) • Delay Studies (parts of travel time that user find particularly annoying)
Type Of Studies • Density Studies (rarely direct measured) • Accident Studies (accident characteristics, causal factor, specific location) • Parking Studies (inventories or parking supply, parking accumulations • Good Movement & Transit Studies (truck loading facilities & transit systems)
Type Of Studies • Pedestrian Studies (crosswalks at signalized/un-signalized locations) • Calibration Studies • Observance Studies (effectiveness of various traffic controls)
VOLUME, DEMAND AND CAPACITY Volume, number of vehicles (persons) passing a point during a specified time period which is usually one hour. Demand, number of vehicles (persons) that desire to travel past a point during a specified period also usually one hour.
VOLUME, DEMAND AND CAPACITY Capacity, maximum rate at which vehicle can traverse a point or short segment during a specified time period Theoretically, actual volume can never be observed at levels higher than the true capacity of the section.
Spot Speed Studies • Typical purposes of speed studies • Speed trends over time • Traffic control planning • Before-and-after studies • Crash analyses • Geometric design • Research studies
Study Locations • Consistent with study purpose • Not where vehicles are accelerating or decelerating • Data collectors must not influence vehicle speeds • Factors that influence speeds • Physical conditions • Environment • Heavy traffic • Enforcement activity
Selecting the Sample • Random but representative • At least 100 vehicles per lane • Free-flowing vehicles only • Common sampling errors • Always selecting platoon leader • Too many trucks • High proportion of speeders • Other events
Collection Of Spot Speeds • Usually cannot collect all vehicles • Random sample • Systematic Errors and Solutions • Error – looking for “fastest” vehicle • Solution – Sample every nth vehicle • Error – too many heavy vehicle measurements • Solution – same as above – sample every nth vehicle • Error – Inclusion of vehicle following platoon leader • Solution – Don’t include vehicles following too closely (200’ if < 40 mph, and 350’ otherwise)
Spot Speed Studies • Speed characteristics from a spot speed study may be used to: • Establish parameters for traffic operation and control, such as speed zones, speed limit (85th percentile speed is commonly used as the speed limit on a road), and passing restriction. • Evaluate the effectiveness of traffic control devices, such as variable message signs at work zones. • Monitor the effect of speed enforcement programs such as the use of drone radar and the use of differential speed limits for passenger cars and trucks.
Spot Speed Studies • Speed characteristics from a spot speed study may be used to: • Evaluate and or determine the adequacy of highway geometric characteristics such as radii of horizontal curves and lengths of vertical curves. • Evaluate the effect of speed on highway safety through the analysis of crash data for different speed characteristics. • Determine speed trends. • Determine whether complaints about speeding are valid.
Methods of Conducting Spot Speed Studies • Road Detectors • Pneumatic road tubes
Methods of Conducting Spot Speed Studies • Road Detectors • Inductive loop
Vehicle Radar beam Bias in Radar Measurements True Speeds (mph) Angle30 50 70 (o) Measured Speeds (mph) 0 30 50 70 5 29.9 49.8 69.7 10 29.5 49.2 68.9 20 28.2 46.7 65.8 45 21.2 35.4 49.5
Cosine Correction Minimize cosine error by keeping angle <7o on freeways, <9o on urban streets
Methods of Conducting Spot Speed Studies • Doppler-Principle Meters
Methods of Conducting Spot Speed Studies • Electronic-Principle Detectors
Volume Studies Traffic volume studies are conducted to collect data on the number of vehicles and/or pedestrians that pass a point on a highway facility during a specified time period. This time period varies from as little as 15 min to as much as a year, depending on the anticipated use of the data. The data collected may also be put into subclasses which may include directional movement, occupancy rate, vehicle classification, and pedestrian age.
Volume Studies Traffic volume studies are usually conducted when certain volume characteristics are needed, some of which follow: Average Annual Daily Traffic (AADT) Average Daily Traffic (ADT) Peak Hour Volume (PHV) Vehicle Classification (VC) Vehicle Miles of Travel (VMT)
Methods of Conducting Volume Counts • Manual Method
Hand-held Traffic Data Collectors http://www.jamartech.com/TMBs.html
Methods of Conducting Volume Counts • Automatic Method
Methods of Conducting Volume Counts • Automatic Method
Type of Volume Counts • Cordon Counts When information is required on vehicle accumulation within an area, such as the central business district (CBD) of a city, particularly during a specific time, a cordon count is undertaken. The area for which the data are required is cordoned off by an imaginary closed loop; the area enclosed within this loop is defined as the cordon area.
Type of Volume Counts • Screen Line Counts In screen line counts, the study area is divided into large sections by running imaginary lines, known as screen lines, across it. In some cases, natural and man-made barriers, such as rivers or railway tracks, are used as screen lines Traffic counts are then taken at each point where a road crosses the screen line. It is usual for the screen lines to be designed or chosen such that they are not crossed more than once by the same street.
Type of Volume Counts • Intersection Counts Intersection counts are taken to determined vehicle classification through movements and turning movements at intersections. These data are used mainly in determining phase lengths and cycle times for signalized intersections, in the design of channelization at intersections, and in the general design of improvements to intersections.
Type of Volume Counts • Pedestrian Volume Counts Volume counts of pedestrians are made at locations such as subway stations, mid-blocks, and crosswalks. The counts are usually taken at these locations when the evaluation of existing or proposed pedestrian facilities is to be undertaken. Such facilities may include pedestrian overpass or underpasses.
Type of Volume Counts • Periodic Volume Counts In order to obtain certain traffic volume data, such as AADT, it is necessary to obtain data continuously. However, it is not feasible to collect continuous data on all roads because of the cost involved.
Type of Volume Counts • Periodic Volume Counts To make reasonable estimates of annual traffic volume characteristics on an area-wide basis, different types of periodic counts, with count durations ranging from 15 min to continuous, are conducted; the data from these different periodic counts are used to determine values that are the used to estimate annual traffic characteristics. The periodic counts usually conducted are continuous, control, or coverage counts.
TYPICAL COUNTING PERIODS • 24-hour 1 or more 24-hour periods • 16-hour 6 am – 10 pm (90-95% of daily traffic) • 12-hour 7 am – 7 pm (about 75% of daily traffic) • Peak-periods 7 am – 9 am and 4 pm – 6 pm • Weekend 6 pm Friday – 6 am Monday
Applications of Travel Time and Delay Data • The data obtained from travel time and delays studies may be used in any one of the following traffic engineering tasks: • Determination of the efficiency of a route with respect to its ability to carry traffic. • Identification of locations with relatively high delays and the causes for those delays. • Performance of before-and-after studies to evaluate the effectiveness of traffic operation improvements
Applications of Travel Time and Delay Data • Determination of relative efficiency of a route by developing sufficiency ratings or congestion indices • Determination of travel times on specific links for use in trip assignment models • Compilation of travel time data that may be used in trend studies to evaluate the changes in efficiency and level of service with time. • Performance of economics studies in the evaluation of traffic operation alternatives that reduce travel times.
Benefits of Travel Time & Delay Studies • It provides real-time data on the operations of roadways. • It can be used to determine capacity deficiencies which can be translated into future capital improvement projects. • If data is collected yearly, historical data can be assembled which can help determine deteriorating capacity trends and therefore potential future projects.
Benefits of Travel Time & Delay Studies • It can be used to compare before and after conditions for completed capacity improvement projects. • It provides data to calibrate traffic studies done within the County. • It can assist the Traffic Concurrency approval process.
Methods for Conducting Travel Time and Delay Studies • Methods requiring a test vehicle • Floating-car technique • Average-speed technique • Moving-vehicle technique • Methods not requiring a test vehicle • License-plate observations • Interviews
Methods for Conducting Travel Time and Delay Studies • Methods requiring a test vehicle • Floating-car technique In this method, the test car is driven by an observer along the test section so that the test car “floats” with the traffic. The driver of the test vehicle attempts to pass as many vehicles as those that pass his test vehicle The time taken to traverse the study section is recorded. This is repeated, and the average time is recorded as the travel time.