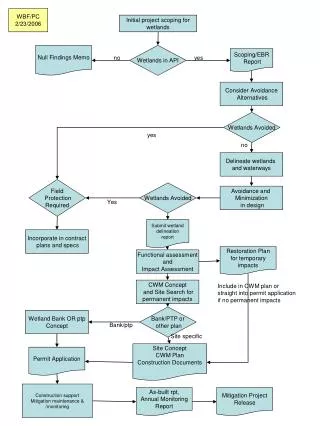
Scoping and Launching the Project
750 likes | 978 Vues
Scoping and Launching the Project. Dr. Vijay Kanabar , PMP Boston University. Project Methodology. Stages:. Plan. Define. Execute. Close Out & Celebrate. Continuous Assessment (Risk mgmt, plan control, change mgmt). Outputs:. Stakeholder Analysis Project Proposal Project Charter

Scoping and Launching the Project
E N D
Presentation Transcript
Scoping and Launching the Project Dr. Vijay Kanabar, PMP Boston University
Project Methodology Stages: Plan Define Execute Close Out & Celebrate Continuous Assessment (Risk mgmt, plan control, change mgmt) Outputs: • Stakeholder Analysis • Project Proposal • Project Charter • Statement of Work (SOW) • Communication Plan • Responsibility Matrix • Work Breakdown Structure (WBS) • Critical Path • Scheduling • Risk Assessment • Resource Plan • High Performing Team • Scope Control • Stakeholder Management • Final deliverables Project Plan
Communications Management Including Resource Planning
Communication Management • Communications management is about keeping everyone aware about what is going on with the project. “Up to 90% of a project manager's time is spent in communications management.” - PMI
Communication Requirements • Responsibility – who ‘owns’ what • Coordination – keeping it going together • Status – progress, issues, resolutions • Authorization – decisions made
Tools • Status report • Dashboard? • Open task report • Past due • Short-view task list • Forecast of what comes next • Issues log • What is happening, who can fix it • Change control process • Automated/manual • Levels of approval • Implications for other tasks & deliverables
Types Of Reports Different types of reports are sent to Different types of audience. Report type Audience Executive status report Senior Management Status report Project sponsor Project report Project team Task report Team members
PMI Processes for Communications Plan Communications Distribute Information Manage Stakeholders Expectations Report Performance Planning Executing Monitor & Control Ref: PMBOK 4th Edition.
Project Manager Role in Communication • Project managers must keep the following informed: • Project owners • Team members • Management • Subcontractors and • Stakeholders. • Anyone else?
Communication Activities Communication Activities involve Developing a communication management plan Managing stakeholders Distributing project information in a timely manner Motivating teams Resolving conflicts.
Communications Model Messages are encoded and decoded using a device or technology before they travel over the medium.
The Communication Process Receiver provides verbal and nonverbal responses to sender Sender has idea Sender encodes idea into a message Message travels over one or more channels Receiver perceives and decodes message Sender’s response to feedback may trigger additional feedback to receiver
The Communication ProcessMessage • The message refers to the verbal (spoken and written) symbols and nonverbal cues representing the information that the sender wants to convey. • Nonverbal Messages • Verbal Messages • Written Messages
Filters There are filters on both sides of the sender and receiver that hinder communication. a.Language: technical material, lack of clear communication channels, physical separation, personality conflicts, culture, semantics, and message content (could be intertwined with hidden agendas). b.Environmental background: psychological and sociological parameters, dysfunctional emotional behaviors. Different educational backgrounds.
Filters (contd.) c.Authority/Reputation d.Pre-determined mind-set:Havinga self-fulfilling philosophy or unfounded assumptions. e.Historical consideration: The way a task was always done.
Barriers Communication barriers including mumbling, long distance, static or noise and negative attitudes or power play. Examples are listed below : • Noise • Pre-occupation • Power game • Withholding information • Management by Memo • Hostility • Filters
Too Many Communication Channels Lines of communication = N (N-1)/2 • Communication can become a very complex activity in large project settings. • Formula that will calculate the lines of communication or the communication channels based on the number of people involved in a project
Communication Management Plan The Communication Management Plan is the primary output of the communications planning process. Communication Management Plan is created by the project manager and becomes part of the project plan. The purpose is to inform all stakeholders how and in what form communications will be handled on the project.
Responsibility Assignment Matrix • A Responsibility Assignment Matrix (RAM) is a matrix that maps the work of the project as described in the WBS to the people responsible for performing the work as described in the organization breakdown structure (OBS). • For smaller projects assign individual people to WBS activities. • For very large projects, it is more effective to assign the work to organizational units or teams. WBS Activities OBS Units R = Responsible organizational unit P = Performing organizational unit
GR 1 GR 2 GR 3 GR 4 GR 5 GR 6 GR 7 Business Case Opportunity Capture Strategy Proposal Program Design Proposal Proposal Quality Identification Go / No - Go Feasibility Responsiveness (Submission) & Compliance X X CEO (if signature required) CFO X X X COO X X (Ops/ Logistics) VP Human X X Resources VP CCE X X (if CCE project) VP Strategy X VP Programs X X X VP Region X X X X Director G&C X X Country R ep / X X X CoP Director NBD X X X X X X Responsibility Matrix - For Decision Making
Resource Planning Determining what resources (people, equipment, materials) are needed in what quantities to perform project activities. PMBOK Glossary
Resource Requirements Inputs Tools and Techniques • Work Breakdown Structure • Historical information • Scope statement • Resource pool description • Organizational policies • Activity duration estimates • Expert judgment • Alternatives identification • Project management software Outputs • Resource requirements
Responsibility Matrices • Also called a linear responsibility chart. • Summarizes the tasks to be accomplished and who is responsible for what on the project. • Lists project activities and participants. • Clarifies critical interfaces between units and individuals that need coordination. • Provide an means for all participants to view their responsibilities and agree on their assignments. • Clarifies the extent or type of authority that can be exercised by each participant.
RACI Matrix is widely used People who do the work Makes sure work is done Provide work input Progress Report provided Or could be Assist, Coordinate, Sign-off, Review etc.
Project Methodology Stages: Plan Define Execute Close Out & Celebrate Continuous Assessment (Risk mgmt, plan control, change mgmt) Outputs: • Stakeholder Analysis • Project Proposal • Project Charter • Statement of Work (SOW) • Communication Plan • Responsibility Matrix • Work Breakdown Structure (WBS) • Critical Path • Scheduling • Risk Assessment • Resource Plan • High Performing Team • Scope Control • Stakeholder Management • Final deliverables
iBasis Project/Initiative Discussion Communications Plans • Form into groups based on group lists • Combine break & work session = 30 Minutes • Continue to discuss project/initiative that was assigned to your group • Brainstorm and document: • Identify the key components of a project communications plan for your projects. • Vijay – Identify key frameworks that you want them to use here • Action: Be prepared to present your communications plan xxx framework/template to the larger group • Pick a spokesperson to represent you
Risk Management Dr. Vijay Kanabar, PMP Boston University
Risk Management Planning Risk Management Planning is a process that describes your strategy to manage the entire risk management activities for a project.
Why Risk Management? Project managers and project teams are always more optimistic than they should be. Risk management balances out undue optimism by introducing a process that constantly asks “what if?”
Philosophy: Prevention is Better than the Cure! • As in medical practice risk prevention is more cost-effective (and potentially life saving) than risk detection. • Project risks must be tackled actively and prevented. • A good project manager must know how to recognize such risks, evaluate their impact and take steps to counter them.
Process • Identify all risks. • Quantify them in terms of their probability and impact. • high, medium, low, no impact. • Respond • prevent • mitigate • Transfer • Absorb
Let us Make this ComplicatedThere are Threats & Opportunities So far we have defined risk as a threat—event that may cause suffering, harm or loss, but risks are also associated with opportunity—event that may cause us to gain or profit.
A complete example • Risk Identification: Turnover • Based on past history turnover is estimated to be at 0.60. • This is going to increase project duration and project cost. Customer is going to be unhappy. • Risk Quantification: • High Probability, High Consequence. • Risk Response: • Meet with current staff & determine reasons. • Define a back-up staff member for every key technologist. • Define higher documentation standards. • Disperse project information widely.
What are sources of risks in your organization? See Sample List to consider ! Scope creep Resources Low quality Excessive schedule pressure Cost overruns Inadequate configuration control Inadequate cost estimating Excessive paperwork Error prone software /modules Canceled projects Excessive time to market Friction between contractor, client,....
Identifying Risks:Two Different Approaches Generic Approach • Operational risk. • Strategic risk. • Technical risk • Project Environment. • External risk. • Product risk. Top Down Focus on overall development process. Project Based Approach • See next slide. Bottom-Up Focus on individual process or WBS tasks.
Risk Identification During this process youexamine a project to identify areas of potential risk. Risk Identification is a planning process that defines the risks that might affect the project and documents their characteristics.
Use this to Quantify Qualitatively RISK SEVERITY CONTOURS 100% (Unacceptable) High Risk Medium Risk Low Risk Probability (Acceptable) 0% 100% Units of relative loss
Use this to Quantify Quantitatively Example 1 Potential Impact to Project is $450,000 • Should we request a contingency budget of $450,000? • Management might give less as the probability of both risks happening is less than fifty percent.
Example 2 Potential Impact to Project $350,000
Example 3 There is a Project from which we stand to Profit $100,000 if we pursue it aggressively—by developing it very quickly—results in higher market share. However, the probability for success is estimated to be only 20% as all the bells and whistles will not be available in the product. However, if we pursue it more conservatively we will make $20,000, as the competition might have captured a significant portion of the market. But the probabilities for project/product success are 80%--as the developers will have incorporated some additional features.
Example (contd) • Question: Which option should we use? • Use: • Business Profit * Probability
Example (contd) Answer: • Aggressive: $100,000 * 0.20 = $20,000 • Conservative: $20,000 * 0.80 = $16,000 • EMV = +$ 4000 for aggressive choice should be the preferred choice. • Note: You would want a lower number if the risk was negative.
What it looks like Commute: 30 mins to 90 minutes Could be cost or could be schedule risk that is evaluated Monte-Carlo Simulation Sample Diagram using Excel from http://www.projectsmart.co.uk/docs/monte-carlo-simulation.pdf .