Download
1 / 32
320 likes | 505 Vues
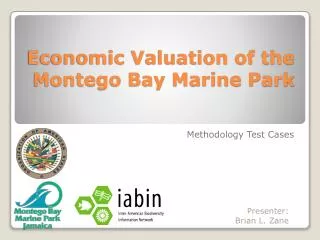
Economic Valuation of the Montego Bay Marine Park. Methodology Test Cases. What? A means to estimate the value of environmental resources How? Different methodologies exist Total economic value = direct-use value + indirect-use value + non-use value

E N D
Economic Valuation of the Montego Bay Marine Park Methodology Test Cases Presenter: Brian L. Zane
What? • A means to estimate the value of environmental resources • How? • Different methodologies exist • Total economic value = direct-use value + indirect-use value + non-use value • Direct – Earnings dependent on the resource (tourism, fishing) • Indirect – biological support, physical protection • Non-Use – option/existence, general knowledge that a resource will still be in place for the next generation • Why? • Consider Conservation vs Development… • Development quantified in economic terms; Conservation traditionally qualified in qualitative or scientific terms. • Economic Valuation provides us with a means to present environmental values in the same way development projects are presented. • Apples for Apples Economic Valuation
Complete three economic valuation methodologies • Garner peer input • Feed outputs into national/international databases • Adjust tools? • Promote wide-scale adoption of selected methodology Purpose of the exercise
Similarities • Purpose/Intent – Quantify the financial value/contribution of ecosystem services towards the local economy Differences • Scope – Coral Reef specific vs All habitats • Medium – Graphic vs Numeric • Inputs – Research vs indigenous knowledge • Scenarios – Dynamic analysis vs static assessment Methodology Comparison
Value Transfer Adapted from: Austin Troy, Matthew A. Wilson ECOLOGICAL ECONOMICS Mapping ecosystem services: Practical Challenges and opportunities in linking GIS & Value Transfer
Values of different habitats are determined • Habitat areas are calculated using GIS • Total ESV is determined by combining values Theory
Process • GIS used to outline ecological resource types • Spreadsheets to multiply resource area against multiplier ($ contribution/hectare/yr) Strengths • Relative Simplicity • Tools - Open source (Coral Point Count) vs Commercial (Google Earth Pro; ESRI) • Data - Not heavily dependent upon external data sources - “involves the adaptation of existing valuation information to new contexts where valuation data is absent or limited” • Visual outputs - Graphic outputs readily interpreted and multi-purposed Weaknesses • Value Multipliers not universally applicable • Development of new multipliers is an extensive undertaking Overview
Pros • User friendly • Necessary inputs are free and readily accessible • Low dependence on external/hard to locate data sources • Produces both graphic and numeric results • Cons • Multipliers (values) developed for NE United States • Not all local habitats represented • Challenging to develop local values, which are critical to the accuracy and validity of the tool Summary
World Resources Institute Coral Reef Valuation
Process • Review spreadsheets & manuals • Analyze Data requirements • Collect Data • Enter data, review results, modify, review, modify… • Calculate scenarios Strengths • Highly detailed results • Triangulates ESV of coral reefs • Tools – MS Excel Weaknesses • Data - Heavily dependent upon external data sources • Aspects not yet developed (Coastal Protection) • Dependencies/Assumptions (built into formulas) • Complexity reduces probability of widespread adoption Overview
Marine Park Category (Zero Rated) – WHY? No conventional cost recovery mechanisms (reflected in the tool) are currently implemented in the park. • Visitor Fees • Entrance – No single entry point • Diving – No fees in place • Snorkeling – No fees in place • Concessions – No concessions in operation • Vessel Fees • Entry – Collected & held by Port Authority (no estimate available) • Mooring – No fees in place • Other Fees • Fishing Permits (Fisheries Division) • Research Licenses (NEPA) Areas where Park Manager has recuperated operational expenses: • Beach Fees • ~US$7,000 (3 or 4 disbursements since park inception) • Management Fee • ~US$40,000/yr (Pegged to management agreement; two years since inception) • National Park Trust Fund • ~US$25k – 35k (every second/third year depending on interest earned by fund) Each allocation changes in frequency and amount, and doesn’t fit into provided categories and therefore was not included. Anomalies – Marine Park Revenue
Cruise Ships • Estimated +150,000 visitors to Montego Bay not accounted for • Cruise Ship calculations not included; tool not yet developed • Would push overall valuation figure up Coastal Protection • Third valuation tool not yet developed • Would add critical third figure to overall Coral Reef Valuation figure Multiplier • Total Indirect Impacts • Function did not work Anomalies - Undervaluation
Tourism: US$119,315,604 • Fisheries: US$1,128,748 • Coastal Protection: (N/A) $120,444,352 WRI Valuation - Totals
Coral Reef Valuation – Tourism • Coral Reef Valuation – Fisheries • Coral Reef Valuation – Coastal Protection Coral Reef Valuation - Process
Preferred Methodology? • Data Requirements • Sources • Relevance • Date • Considerations for broader use • Stakeholders • Results Sharing • Database Integration • Willingness, Value, Application, Acceptance Discussion
Thank you! Brian L. Zane
* All figures in US Dollars Results Comparison (Alt. View)
Marine Park Bogue Lagoon – Fish Sanctuary Western Boundary of Park (Great River outflow – sediment plume) Urban Gully influences Montego Bay Marine ParkDistinct Features - Google Earth Brian L. Zane
Bogue Lagoon prior to construction Freeport during construction Cruise Terminal Freeport/Lagoon 1990s Historical Perspectives Brian L. Zane