Download
1 / 12
120 likes | 420 Vues
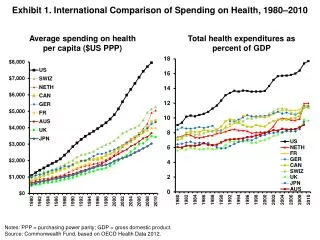
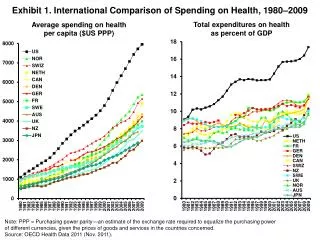
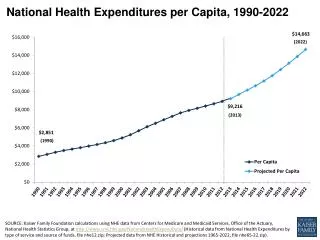
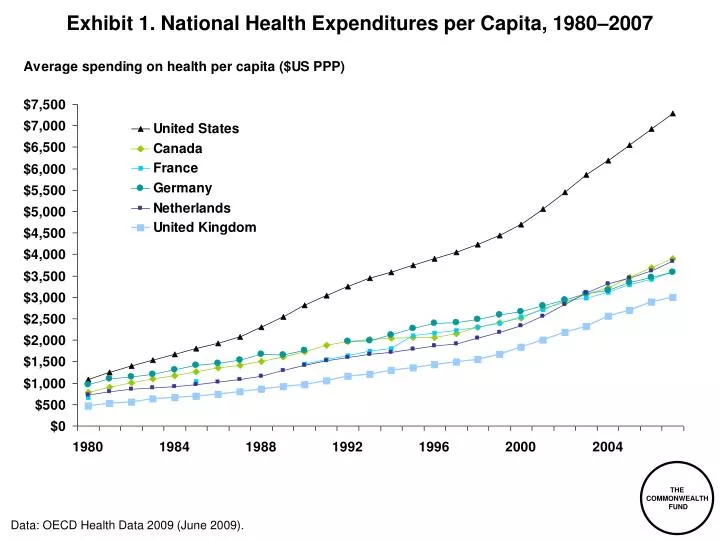
Exhibit 1 . National Health Expenditures per Capita, 1980–2007. Data: OECD Health Data 2009 (June 2009). Exhibit 2 . National Health Expenditures as a Percentage of Gross Domestic Product, 1960–2020. Percent. Projected. Data: Centers for Medicare and Medicaid Services, The Lewin Group.

E N D
Exhibit 1. National Health Expenditures per Capita, 1980–2007 Data: OECD Health Data 2009 (June 2009).
Exhibit 2. National Health Expenditures as a Percentage ofGross Domestic Product, 1960–2020 Percent Projected Data: Centers for Medicare and Medicaid Services, The Lewin Group.
Exhibit 3. Average Family Premium as a Percentage of Median Family Income, 1999–2020 Percent Projected Data: Commonwealth Fund calculations based on Kaiser/HRET, 1999-2008; 2008 MEPS-IC; U.S. Census Bureau, Current Population Survey; Congressional Budget Office.
Exhibit 4. Total Number of Uninsured, 1963–2010 Millions uninsured Note: Figures for 1963-1974 are U.S. residents without hospital insurance. Data: National Health Interview Survey, Current Population Survey, The Lewin Group.
Exhibit 5. National Health Expenditures (NHE) Under Alternative Scenarios, U.S. Constant 2010 Dollars, 1960–2010 NHE in billions $2,624 5.2% annual growth 4.8% annual growth $2,110 $1,702 $1,583 4.3% annual growth 4.2% annual growth Data: The Centers for Medicare and Medicaid Services; Bureau of Labor Statistics, Office of Management and Budget, Congressional Budget Office.
Exhibit 6. National Health Expenditures (NHE) Under Alternative Scenarios, U.S. Constant 2010 Dollars, 1960–2010 NHE in billions $2,624 5.2% annual growth $2,270 4.9% annual growth $1,967 $1,875 4.6% annual growth 4.5% annual growth Data: The Centers for Medicare and Medicaid Services; Bureau of Labor Statistics, Office of Management and Budget, Congressional Budget Office.
Exhibit 7. National Health Expenditures (NHE) Under Alternative Scenarios, Percentage of Gross Domestic Product, 1960–2010 NHE (% GDP) 17.7% 14.2% 11.5% 10.7% 9.0% 3.8% Data: The Centers for Medicare and Medicaid Services; Bureau of Labor Statistics, Office of Management and Budget, Congressional Budget Office.
Exhibit 8. National Health Expenditures (NHE) Under Alternative Scenarios, Percentage of Gross Domestic Product, 1960–2010 NHE (% GDP) 17.7% 15.3% 13.3% 12.7% 9.0% 3.8% Data: The Centers for Medicare and Medicaid Services; Bureau of Labor Statistics, Office of Management and Budget, Congressional Budget Office.
Exhibit 9. Federal Health Expenditures (FHE) Under Alternative Scenarios, Percentage of Gross Domestic Product, 1960–2010 FHE (% GDP) 6.2% 5.0% 4.0% 3.7% Data: The Centers for Medicare and Medicaid Services; Bureau of Labor Statistics, Office of Management and Budget, Congressional Budget Office.
Exhibit 10. Federal Health Expenditures (FHE) Under Alternative Scenarios, Percentage of Gross Domestic Product, 1960–2010 FHE (%GDP) 6.2% 5.3% 4.6% 4.4% Data: The Centers for Medicare and Medicaid Services; Bureau of Labor Statistics, Office of Management and Budget, Congressional Budget Office.
Exhibit 11. System Improvement Provisions of National Health Reform Proposals, 2009 Source: K. Davis, S. Guterman, S. R. Collins et al., Starting on the Path to a High Performance Health System: Analysis of Health System Reform Provisions of Reform Bills in the House of Representatives and Senate(New York: The Commonwealth Fund, Dec. 2009).
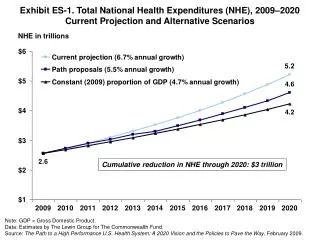
Exhibit 12. Total National Health Expenditures (NHE), 2009–2019, Current Projection and Alternative Scenarios NHE in trillions 6.6% annual growth $4.8 $4.7 $4.5 6.4% annual growth 6.0% annual growth $2.5 * Modified current projection estimates national health spending when corrected to reflect underutilization of services by previously uninsured. Source: D. M. Cutler, K. Davis, and K. Stremikis, Why Health Reform Will Bend the Cost Curve(Washington and New York: Center for American Progress and The Commonwealth Fund, Dec. 2009).