Download
1 / 47
470 likes | 861 Vues
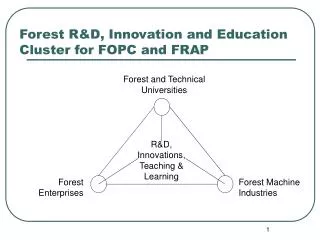
Anne Kenworthy. TIRF, FRAP, photoactivation. Total internal reflection fluorescence (TIRF) microscopy FRAP and photoactivation -General principles -An example of FRAP in action -Considerations for experimental design. QFM 2014. Total Internal Reflection Fluorescence (TIRF) Microscopy.

E N D
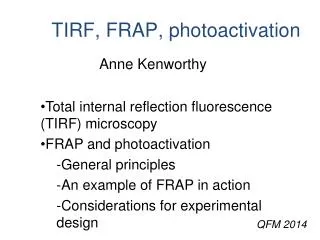
Anne Kenworthy TIRF, FRAP, photoactivation • Total internal reflection fluorescence (TIRF) microscopy • FRAP and photoactivation • -General principles • -An example of FRAP in action • -Considerations for experimental design QFM 2014
Total Internal Reflection Fluorescence (TIRF) Microscopy • The problem: how to visualize events occurring at the plasma membrane in the presence of “stuff” going on in the rest of the cell? • What TIRF does:illuminates only fluorescent structures very near the coverslip (≤100 nm) • How it does it:excites molecules using an evanescent field • Advantages:Low background fluorescence, no out-of-focus fluorescence, minimal exposure of the sample to light except at the surface
TIRF illuminates fluorescent molecules localized at or close to the cell surface GFP-clathrin light chain Caveolin-1-GFP Mattheyses et al 2010 J Cell Sci 123: 3621
n2 ~ 1.38 n2 = 1.515 Mattheyses et al 2010 J Cell Sci 123: 3621
TIRF essentials • Total internal reflection occurs at angles greater than the critical angle and generates an evanescent wave in the sample • The intensity of the evanescent wave decays exponentially • Only fluorophores within the evanescent wave are excited • The depth of penetration d depends on the wavelength of excitation light used, the angle, and the refractive indices of the media and coverslip • Typical values of d range from 60 -100 nm
Refraction and reflection Millis (2012) Methods in Molecular Biology 823:295
Critical angle Millis (2012) Methods in Molecular Biology 823:295
Critical angle Total internal reflection occurs when light propagating through a transparent medium of high refractive index (ex. glass, n = 1.518) encounters a planar interface of a medium of a lower refractive index (ex. water/cell, n= 1.33-1.37) for angles of incidence greater than the critical angle c = sin-1 (n1/n2) where n1 and n2 are the refractive indices of the sample and coverslip, respectively For < c most light is refracted (and enters the sample) For > c all of the light reflects back into the solid; evanescent field is formed
Total internal reflection generates an evanescent wave Millis (2012) Methods in Molecular Biology 823:295
Properties of the evanescent field The intensity of the evanescent wave decays exponentially at a distance z perpendicular to the interface as I(z) = I(0)-z/d where d = (o/4π)(n22 sin2 - n12)-1/2 and o is the wavelength of the incident light, n1 and n2 are the refractive indices of the sample and coverslip, respectively, and is the incidence angle d increases with increasing d decreases with increased incidence angle The depth of penetration depends on the wavelength of excitation light used, the angle, and the refractive indices of the media and coverslip
Achieving TIRF using through-the-objective TIRF • To achieve TIRF, the NA of the objective must be greater than the refractive index of the sample • Refractive index of cell ~ 1.38 • Common TIRF objectives: 1.45 NA and 1.49 NA • To achieve an angle of illumination greater than the critical angle, the laser beam is focused off axis on the back focal plane • Higher NA lenses allow for larger incidence angles http://www.microscopyu.com/articles/fluorescence/tirf/tirfintro.html
TIRF test sample- fluorescent beads Focusing at coverslip Focusing deeper into sample epifluorescence TIRF Mattheyses et al 2010 J Cell Sci 123: 3621
Kinase-regulated quantal assemblies and kiss-and-run recycling of caveolae Lucas Pelkmans and Marino Zerial Nature 436, 128-133(7 July 2005) doi:10.1038/nature03866
Kinase-regulated quantal assemblies and kiss-and-run recycling of caveolae Lucas Pelkmans and Marino Zerial Nature 436, 128-133(7 July 2005) doi:10.1038/nature03866
Fluorescence recovery after photobleaching (FRAP) and photoactivation
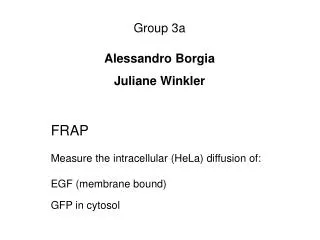
Fluorescence recovery after photobleaching (FRAP) • In FRAP, a population of fluorescent molecules in a region of interest is irreversibly photobleached • Recovery of fluorescent molecules back into that same region is monitored over time • This allows you to measure the characteristic kinetics of underlying motion of the fluorescently tagged molecules • This approach can be readily used in measurements of diffusion and other forms of transport, including vesicular trafficking • FRAP can be carried out on most confocal microscopes and for many commonly used fluorophores
Prebleach t=0 10s 100s Large-scale confocal FRAP measurements of protein diffusion 10 mm GFP-KRas, COS-7, 37º C Kenworthy et al (2004)
Photoactivation/photoconversion • Certain fluorophores and fluorescent proteins exhibit little of no fluorescence at certain wavelengths until they are photoactivated • This allows one to control the time and place at which fluorescence is “turned on” • The redistribution of the photoactivated molecules can then be monitored over time • Applications of photoactivatable FPs include: • Protein dynamics • Fluorescence pulse labeling • Photoquenching FRET • Photoactivated Localization Microscopy (PALM)
A. Highlight molecules for tracking B. Diffusion C. Pulse-chase G. Patterson Methods in Cell Biology Volume 85, 2008, Pages 45-61 Fluorescent Proteins
Figure 21.6.3. Selective photoactivation of PA-GFP.A COS-7 cell expressing PA-GFP was imaged using low levels of 488-nm light before and after photoactivation of the nuclear region (indicated by the white circle) with ~1 sec of 413-nm light. The images were acquired at 15.75-sec intervals. Current Protocols in Cell Biology UNIT 21.6Photoactivation and Imaging of Photoactivatable Fluorescent Proteins George H. Patterson1 1Cell Biology and Metabolism Branch, National Institute of Child Health and Human Development, National Institutes of Health
Why use FRAP or photoactivation? • FRAP and photoactivation can measure diffusion (Brownian motion), which depends on • Molecular size • Local environment • Binding interactions • FRAP and photoactivation can also provide information about • Reversible membrane binding • Intracellular transport • Continuity of compartments • Stability of molecular complexes
Autophagy is a major lysosomal degradation pathway 2. Trafficked to the lysosome for degradation Autophagosome 1. Cytosolic materials are captured in double membrane vesicle Lysosome
LC3 functions in autophagosomal membrane expansion/fusion and cargo selection
EGFP-LC3 is widely utilized as a reporter of autophagy Drake et al (2010)
EGFP-LC3, a marker for autophagosomes… is enriched in the nucleus ??? Drake et al (2010)
Is active nuclear transport involved in the nucleo-cytoplasmic transport of LC3?
LC3 contains a putative NES, but is unaffected by blockade of nuclear export or mutation of the NES Drake et al (2010)
Does EGFP-LC3 passively equilibrate across the nuclear envelope?
LC3 enters the nucleus slowly compared to EGFP Drake et al (2010)
LC3 exits the nucleus slowly compared to EGFP Drake et al (2010)
LC3 undergoes little active or passive nuclear transport Is it trapped in the nucleus?
Models • LC3 binds to nuclear components such as chromatin • LC3 binds to other proteins and forms a complex that is too large to pass through nuclear pores Both of these models predict that LC3 should not diffuse like a monomeric protein
If EGFP-LC3 exists as a freely diffusing monomer, its diffusion should be similar to that of EGFP = viscosity R = hydrodynamic radius kBT D = (6πR) Stokes-Einstein equation
Setup for FRAP analysis of diffusion Kraft and Kenworthy, 2012
prebleach t=0 0.14s 1s 5s EGFP EGFP-LC3 tfLC3 EGFP-p53 2 m
LC3 diffuses more slowly than predicted by its molecular weight Drake et al (2010)
Implications • Our findings suggest that the nuclear localization of LC3 is not an artifact, rather that the protein has a currently unrecognized, novel nuclear function • Our diffusion measurements indicate that LC3 either transiently binds immobile structures in the cell in both the nucleoplasm and cytoplasm, or diffuses as part of a high molecular weight (~1 MDa!) macromolecular complex • How can we distinguish between these possibilities? • FRET • FCS
Considerations for experimental design, data analysis, and interpretation
Getting started • Define beaching conditions • Bleach region geometry and size • A smaller region will recover faster • Region of interest to monitor recovery • Bleach ROI only vs surrounding area of cell • Bleach depth/bleach iterations • More iterations is not always better • Confirm the minimal number needed using a fixed sample • In general bleach time should be less than 0.1 t1/2 • Define imaging conditions • Minimize photobleaching during the recovery phase • Recovery time is sufficiently long to reach plateau
What to look for: a “good” experiment A 0 s 70 s 10 s Prebleach 3 1 2 B C
Photobleaching during the recovery and/or focal plane changes A Fluorescence Intensity B Bumping the microscope Time (s) Goodwin and Kenworthy 2005
Fast diffusion is characterized by Low apparent bleach depth in live vs fixed sample Short halftime of recovery Depletion of fluorescence outside the bleach region immediately following the bleach Hallmarks of fast vs slow diffusion