Download
1 / 39
400 likes | 590 Vues
7-Way to Reduce Postmeal Blood Sugar Peak . Hannah Mitter Nutritionist with BS & MS in Nutrition BSRN, DNP-UIC Student, Diabetes Educator, Adjunct Faculty Ambria College of Nursing . Normal Blood Sugar ranges. Fasting: 80-99 1-hr: <130 2-hr: <120 3-hr: 90-100 4-hr: 80-100

E N D
7-Way to Reduce Postmeal Blood Sugar Peak Hannah Mitter Nutritionist with BS & MS in Nutrition BSRN, DNP-UIC Student, Diabetes Educator, Adjunct Faculty Ambria College of Nursing
Normal Blood Sugar ranges • Fasting: 80-99 • 1-hr: <130 • 2-hr: <120 • 3-hr: 90-100 • 4-hr: 80-100 • 5-hr: 80-100
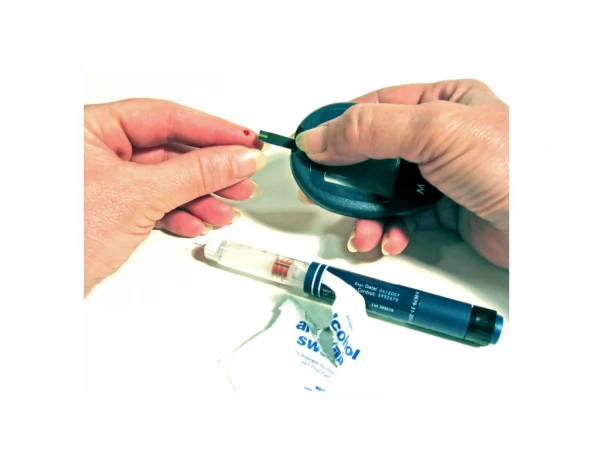
Blood Sugar Test, 1987 FBS 30m 1hr 90m 2hr 3hr 4hr 5hr Hannah84 220 212 - 149 89 68 - Rebekah81 93 66 82 69 72 80 80 Hannah-Prediabetes Rebekah–Hypoglycemia due to Hyperinsulism
7-way • 3 meals & 3 snacks: meal portion control • Eat whole grain, whole some food • Avoid simple sugars, & eat complex carbs • Eat a mixed meal w/carb, proteins, fats • Increase soluble fibers • Stress management: caffeine effects • Postmeal exercise: walk for 15-30min
1. Meal Portion Control a. Meal pattern: 3 meals & 3 snacks b. Carb control by carb counting c. Serving numbers per meal & snack
2. Whole grain • Compare Brown & White rice • Compare whole grain & white breads • Two reasons to eat whole grain 1. Nutrients: Vitamin Bs & minerals in fiber and germ 2. Lower Glycemic Index
Whole Wheat • Bran • Germ
Carb, Fat, Protein Metabolism(B1, B2, B3, B5, B6, B12, folate, Biotin)
Glycemic Index Low GI <55, Med GI 56-69, High GI >70 • White bread 72 Whole grain bread 55 pumpernickel bread 49, Rye (whole) 50 Rye regular 64 Corn tortilla 70, French bread 96 Waffles 76 • All Bran 43 Rice Krispies 82 Corn fakes 84 Oatmeal Quick 66 Soy bean 18 Black bean 30 Lentil (red) 25 kidney bean canned 52 Fava beans 80 • White rice 70, Millet 71, rice instant 85-91 Brown rice 56, Buckwheat 54, Barley, pearled 25 Cornmeal 68, Bulgar 47, Chick pea 33, Pinto bean 39
GI cont • Milk regular 27 skim 32 Sweet potato 54 Potatoes russet baked 90 corn 55-60 Pasta whole grain 45 tomato 38 Corn chips 70, pretzel 82, Grapefruit 25 • Strawberries 32 Apple 39 Oranges 40 Water melon 72, Cantaloupe 65, Banana 60 Cherries 23 Pear 35, Raisin 64 pineapple 66 Grapes 43-50 Apple juice 41 Orange juice 45-57 Grape fruit juice 49 • Graham cracker 74 Rice cake 77, stoned wheat thins 68
3. Avoid Simple sugar & eat complex carbohydrates • Simple sugar: a. Single sugars -glucose, fructose -high fructose corn syrup: glucose 45%/fructose 55% b. Double sugars -Table sugar (Sucrose)= glucose (50%) +fructose(50%) -Honey=Glucose (52%) + Fructose (48%) *Milk sugar (Lactose)=glucose + galactose -Maltose=glucose + glucose C. Complex carbohydrates: Starch (rice, noodle, bread, potatoes, beans)
Glycemic Index • Sugar 61 – Honey 55 • Milk sugar 46 - Milk 27 • Apple 34 – Orange 42 • Peach 45 • Grape 46-Banana 52 • Watermelon 72- Pineapple 59 • Proteins & Fats: allZero ex) Egg, Chicken, Fish, Beef, Pork, Oil-
4. Eat a Mixed meal • A meal mixed with Carbohydrates, Proteins, Fats • Benefits: -Fat & protein food delay stomach emptying, You feel full longer. -The meal digested slower and increase blood sugar slowly. -A mixed carb, protein & fat meal takes 4 hrs to complete emptying stomach, while carb food alone take only 2 hrs
5. Increase soluble fiber 1. Reduce post meal blood sugar peak - delay emptying stomach - absorb glucose like sponge in small intestine; prevent high blood sugar peak 2. Lowering cholesterol - bind bile acids (cholesterol) like sponge- remove cholesterol through bowel movement • Soluble fiber: oat, barley, beans, apple skin, orange, guar gum, sea weeds, asparagus, egg plants • Insoluble fiber: celery, broccoli, lettuce, whole grain, seeds
6. Stress management • Manage physical, emotional, & spiritual stress • Stress hormones increase blood sugar 1. Adrenalin 2. Cortisol • Physical stress: lack of sleep, caffeine, nicotine, street drugs, alcohol • Reduce “Fight or Flight Response”
7. Postmeal exercise • Walk for 15-30min after a meal • Start by 20mn from the first bite of the meal: rise high from 30min- highest peak is at 1 hour after a meal • Aeorobic- blood sugar control • Muscle strengthening- increase musclen sizes- then increase number of insulin receptors. Better insulin function
References • Brand-Miller, J. C., Stockmann, K., Atkinson, F., Petocz, P. & Denyer, G. (2009). Glycemic Index, Postprandial glycemia, and the shape of the curve in healthy subjects: analysis of a database of more than 1000 foods. American Journal of Clinical Nutrition, 89, 97-105. • Brand-Miller J., Wolver T. M., Foster-Powell, K. & Colagiuri, S. ( 2003a). The New Glucose Revolution, Marlow & Company, New York • Evagelidou, E. N., Kiortsis, D. N., Bairaktari, E. T., Giapros, V. I., Cholevas, V. K. et al. (2006). Lipid profile, glucose homeostasis, blood pressure, and obesity: Anthropometric markers in macrosomic offspring of nondiabetic mothers. Diabetes Care, 29, 1197-1201. • Galgani, J., Aguirre, C., Diaz, E. (2006). Acute effect of meal glycemic index and glycemic load on blood glucose and insulin responses in humans. [Electronic version] Nutritional Journal, 5( 22), 1475-1482 Retrieved July 15, 2009, from http://www.nutritionj.com/content/5/1/22 • Leipold H., Kautzky-Willer, A., Ozbal, A., Banchaer-Todesa, D., Worda, C. (2004). Fetal hyperinsulism and maternal one-hour postload plasma glucose level. Ostetrics & Gynecology (104), 1301-1306 • Moses, R.G., Barker, M, Winter, M. Petocz, P. & Brand-Miller, J. C. (2009). Can a low glycemic index diet reduce the need for insulin in gestational diabetes mellitus: A randomized trial. Diabetes Care, 32 (6), 995-1001. • Moses, R. G., Luebcke, M., Davis, W. S., Coleman, K. J., Tapsell, L.C. Brand-Miller, J.C., et al. (2006). Effect of a low-glycemic-index diet during pregnancy on obstetric outcomes. The American Journal of Clinical Nutrition, 84, 807-812. • Pederson, J. (1954). Weight and length at birth of infants of diabetic mothers. ActaEndocrinologica, 16, 330-342. • Rolfes, S.R., Pinna, K., & Whitney, E. (2012). Understanding normal and clinical nutrition (9th ed.). Belmont, CA:Wardworth • Nix, S. (2013) William’s basic nutrition and diet therapy (14th ed.). St Louis, Missouri: Elsevier Mosby