Download
1 / 40
400 likes | 520 Vues
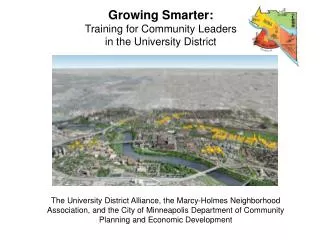
2009 Growth Policy Growing Smarter. Planning Board Status Report May 28, 2009. What’s changing? Why change? Staff Draft Recommendations Smart Growth Criteria APFO Transportation Impact Tax Transportation APFO Schools Outreach Efforts. 2009 Growth Policy APFO – WHAT’S CHANGING?.

E N D
2009 Growth PolicyGrowing Smarter Planning Board Status Report May 28, 2009 • What’s changing? • Why change? • Staff Draft Recommendations • Smart Growth Criteria • APFO Transportation • Impact Tax Transportation • APFO Schools • Outreach Efforts
2009 Growth Policy APFO – WHAT’S CHANGING? • Growth Policy only affects APFO
2009 Growth Policy APFO – WHAT’S CHANGING? • Currently, an applicant must mitigate site impacts: • Local Area Transportation Review • Policy Area Mobility Review • School Impacts
2009 Growth Policy APFO – WHAT’S CHANGING? • Proposed changes allow an applicant to mitigate PAMR by directing 50% of the PAMR fee toward affordable or workforce housing
2009 Growth Policy APFO – BACKROUND • An applicant must mitigate site impacts: • Local Area Transportation Review • Policy Area Mobility Review • School Impacts • LATR impacts in urban areas are often non-existent due to a combination of congestion standards and street grid, but PAMR affects all applicants.
Level of Service F: 0-25% of free-flow auto speed F Level of Service E: 25-40% of free-flow auto speed E Level of Service D: 40-55% of free-flow auto speed D Level of Service C: 55-70% of free-flow auto speed C Level of Service B: 70-85% of free-flow auto speed B Level of Service A: 85-100% of free-flow auto speed A 0 25% 40% 55% 70% 85% 100% PAMR: Arterial Level of Service Congested auto speeds Free-flow auto speeds
PAMR: Arterial Level of Service F E D C B A 0 25% 40% 55% 70% 100% 85%
PAMR: Arterial Level of Service 100% A 85% B 70% C 55% D 40% E 25% F 0%
Arterial Level of Service: Free-flow Conditions • 2.7 miles • 40 mph • 4 minutes
Arterial Level of Service: LOS C • 55% of free-flow speed • 22 mph • 1.5 miles • 4 minutes
Arterial Level of Service: LOS D • 40% of free-flow speed • 16 mph • 1.1 miles • 4 minutes
Level of Service F: Transit speed is less than 42.5% of congested auto speed F Level of Service E: Transit speed is 42.5-50% of congested auto speed E Level of Service D: Transit speed is 50-60% of congested auto speed D Level of Service C: Transit speed is 60-75% of congested auto speed C Level of Service B: Transit speed is 75-100% of congested auto speed B Level of Service A: Transit speed is faster than congested auto speed A PAMR: Transit Level of Service Transit speeds 0% 42.5% 50% 60% 75% 100% Congested auto speeds
0% 42.5% 50% 60% 75% 100% PAMR: Transit Level of Service Transit LOS F E D C B A
100% A 85% B 70% C 55% Arterial LOS D 40% E 25% F 0% 42.5% 50% 60% 75% 100% F E D C B A 0% Transit LOS Scoring Policy Areas Using PAMR
0% 42.5% 50% 60% 75% 100% Scoring Policy Areas Using PAMR 100% A 85% B 70% C 55% Arterial LOS D 40% E 25% F F E D C B A 0% Transit LOS
0% 42.5% 50% 60% 75% 100% Scoring Policy Areas Using PAMR 100% A Acceptable 85% B 70% C 55% Arterial LOS D 40% E Acceptable with full mitigation 25% F E D C B A 0% Transit LOS
0% 42.5% 50% 60% 75% 100% Scoring Policy Areas Using PAMR 100% A Acceptable 85% B 70% C 55% Arterial LOS D 40% E Acceptable with full mitigation 25% F E D C B A 0% Transit LOS
2009 Growth Policy APFO – BACKROUND • The current PAMR requires mitigation in 16 policy areas
2009 Growth Policy APFO – WHY CHANGE? • Guide smarter growth by: • Encourage residential development in urban areas • Move toward thinking in terms of carbon • Promote affordable housing near transit and basic services • Shift APF focus from greenfield to infill; protect established communities
2009 Growth Policy SMART GROWTH CRITERIA • The Smart Growth Criteria proposal considers exemptions from Policy Area Mobility Review based on extraordinary transportation and energy design elements, based on concepts in the LEED rating system and California Senate Bill 375
2009 Growth Policy SMART GROWTH CRITERIA • An applicant can mitigate PAMR by directing 50% of the PAMR fee toward affordable or workforce housing
2009 Growth Policy SMART GROWTH CRITERIA • The Smart Growth Criteria proposal introduces the concept of Road Code Urban Areas in addition to Metro Station Policy Areas. • Both area types are designated for urban street designs and in most cases already have transit service and basic community/retail services.
2009 Growth Policy SMART GROWTH CRITERIA • The Smart Growth Criteria proposal introduces the concept of Road Code Urban Areas in addition to Metro Station Policy Areas. • Both area types are designated for urban street designs and in most cases already have transit service and basic community/retail services.
2009 Growth Policy APFO TRANSPORTATION - BALANCE • The current PAMR requires minimum LOS D for Relative Arterial Mobility
2009 Growth Policy APFO TRANSPORTATION - BALANCE • The Symmetrical PAMR allows LOS E for Relative Arterial Mobility
2009 Growth Policy APFO TRANSPORTATION - BALANCE • The current PAMR requires mitigation in 16 policy areas
2009 Growth Policy APFO TRANSPORTATION - BALANCE • The Symmetrical PAMR requires mitigation in 11 policy areas
2009 Growth Policy APFO TRANSPORTATION – NON-AUTO FACILITIES • Non-auto facilities other than sidewalks and bike paths valued at $11,000 per trip
2009 Growth Policy APFO TRANSPORTATION - TRANSFERABILITY • APF rights could be transferred into an Urban Area from an adjacent policy area
2009 Growth Policy APFO TRANSPORTATION - TRANSFERABILITY • PAMR could be satisfied in Urban Areas by demonstration of mobility standards on affected arterials through adjacent communities
2009 Growth Policy APFO TRANSPORTATION – TRIP GENERATION RATES • Establishment of residential trip generation rates in Urban Areas at 80% of Countywide rates based on MWCOG Household Travel Survey information on vehicle trips.
2009 Growth Policy APFO TRANSPORTATION – WHITE FLINT APF APPROVALS • Follow White Flint Sector Plan implementation proposal to replace APFO transportation tests with system of assessments/taxes
2009 Growth Policy APFO TRANSPORTATION – WHITE FLINT APF APPROVALS • Reduce transportation impact taxes for residential development in Urban Areas (other than MSPAs or Clarksburg) by 33% from General rates based on MWCOG Household Travel Survey information on VMT.
2009 Growth Policy APFO - SCHOOLS Current School Tests Compares projected 2014 enrollment with 2014 classroom capacity for each of the 25 high school clusters at the elementary, middle and high levels. If projected enrollment at any level exceeds 105% of program capacity, residential subdivisions in the affected cluster will be required to make a school facility payment. If projected enrollment at any level exceeds 120% of program capacity, residential subdivisions in the affected cluster will be under moratorium
2009 Growth Policy APFO - SCHOOLS Current School Tests School clusters requiring a school facility payment: B-CC Kennedy Richard Montgomery Northwest Quince Orchard Rockville Wheaton Whitman Wootton School clusters in moratorium: Clarksburg
2009 Growth Policy APFO - SCHOOLS Proposed School Tests If projected enrollment at any level exceeds 110% of program capacity, residential subdivisions in the affected cluster will be required to make a school facility payment. If projected enrollment at any level exceeds 120% of program capacity, residential subdivisions in the affected cluster will be under moratorium Result: reducing from 9 to 5 the number of school clusters facing a school facility payment.
2009 Growth Policy POLICY AREA BOUNDARY CHANGES • Change policy area boundaries to follow recommendations in draft White Flint, Gaithersburg, and Germantown Sector Plans
2009 Growth PolicyGrowing Smarter Planning Board Status Report May 28, 2009 • Current PAMR Process • Why change? • Staff Draft Recommendations • Smart Growth Criteria • APFO Transportation • Impact Tax Transportation • APFO Schools • Outreach Efforts