Download
1 / 13
130 likes | 268 Vues
Mean from a Frequency Table. Calculating the Mean : If there are large amounts of data, it is easier if it is displayed in a frequency table. Example 1. The number of goals scored by Premier League teams over a weekend was recorded in a table. Calculate the mean and the mode. Goals x.

E N D
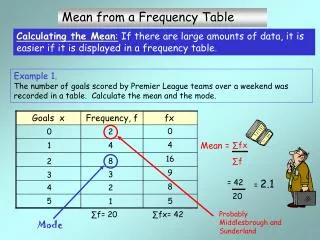
Mean from a Frequency Table Calculating the Mean: If there are large amounts of data, it is easier if it is displayed in a frequency table. Example 1. The number of goals scored by Premier League teams over a weekend was recorded in a table. Calculate the mean and the mode. Goals x Frequency, f fx 0 2 1 4 Mean = ∑fx 8 2 3 ∑f 3 = 42 4 2 20 5 1 Probably Middlesbrough and Sunderland Mode 0 4 16 9 = 2.1 8 5 ∑f= 20 ∑fx= 42
Grouped Data Large quantities of data can be much more easily viewed and managed if placedingroupsin afrequency table. Grouped data does not enable exact values for the mean, median and mode to be calculated. Alternate methods of analyising the data have to be employed. Example 1. During 3 hours at Heathrow airport 55 aircraft arrived late. The number of minutes they were late is shown in the grouped frequency table below. minutes late frequency 0 - 10 27 10 - 20 10 20 - 30 7 30 - 40 5 40 - 50 4 50 - 60 2 Data is grouped into 6 class intervals of width 10.
Grouped Data Estimating the Mean:An estimate for the mean can be obtained by assuming that each of the raw data values takes the midpoint value of the interval in which it has been placed. Example 1. During 3 hours at Heathrow airport 55 aircraft arrived late. The number of minutes they were late is shown in the grouped frequency table below. minutes Late Frequency,f midpoint(x) fx 0 - 10 27 10 - 20 10 20 - 30 7 30 - 40 5 40 - 50 4 50 - 60 2 5 135 150 15 175 25 35 175 45 180 55 110 Mean estimate = 925/55 = 16.8 minutes
Grouped Data The Modal Class The modal class is simply the class interval of highest frequency. Example 1. During 3 hours at Heathrow airport 55 aircraft arrived late. The number of minutes they were late is shown in the grouped frequency table below. Modal class = 0 - 10 minutes late frequency 0 - 10 27 10 - 20 10 20 - 30 7 30 - 40 5 40 - 50 4 50 - 60 2
Grouped Data The Median Class Interval The Median Class Interval is the class interval containing the median. Example 1. During 3 hours at Heathrow airport 55 aircraft arrived late. The number of minutes they were late is shown in the grouped frequency table below. minutes late frequency 0 - 10 27 10 - 20 10 20 - 30 7 30 - 40 5 40 - 50 4 50 - 60 2 The 28th data value is in the 10 - 20 class (55+1)/2 = 28
Grouped Data Example 2. A group of University students took part in a sponsored race. The number of laps completed is given in the table below. Use the information to: (a) Calculate an estimate for the mean number of laps. (b) Determine the modal class. (c) Determine the class interval containing the median. number of laps frequency (x) 1 - 5 2 6 – 10 9 11 – 15 15 16 – 20 20 21 – 25 17 26 – 30 25 31 – 35 2 36 - 40 1 Data is grouped into 8 class intervals of width 4.
Grouped Data Example 2. A group of University students took part in a sponsored race. The number of laps completed is given in the table below. Use the information to: (a) Calculate an estimate for the mean number of laps. (b) Determine the modal class. (c) Determine the class interval containing the median. number of laps frequency midpoint(x) mp x f 1 - 5 2 6 – 10 9 11 – 15 15 16 – 20 20 21 – 25 17 26 – 30 25 31 – 35 2 36 - 40 1 3 6 8 72 13 195 18 360 23 391 700 28 66 33 38 38 Mean estimate = 1828/91 = 20.1 laps
Grouped Data Example 2. A group of University students took part in a sponsored race. The number of laps completed is given in the table below. Use the information to: (a) Calculate an estimate for the mean number of laps. (b) Determine the modal class. (c) Determine the class interval containing the median. number of laps frequency (x) 1 - 5 2 6 – 10 9 11 – 15 15 Modal Class 26 - 30 16 – 20 20 21 – 25 17 26 – 30 25 31 – 35 2 36 - 40 1
Grouped Data Example 2. A group of University students took part in a sponsored race. The number of laps completed is given in the table below. Use the information to: (a) Calculate an estimate for the mean number of laps. (b) Determine the modal class. (c) Determine the class interval containing the median. number of laps frequency (x) 1 - 5 2 (91+1)/2 = 46 6 – 10 9 11 – 15 15 16 – 20 20 21 – 25 17 26 – 30 25 31 – 35 2 36 - 40 1 The 46th data value is in the 16 – 20 class
Weighted Means • Grade point average (GPA): Most colleges assign "weights" to the individual course grades in the form of credits. A grade in a 4-credit course affects your GPA more than a grade in a 3-credit course. For example, suppose Joe took the following courses: • COURSE CR GR Calculus 4 C Discr. Math 3 A English Lit. 3 A Chemistry 4 D Comp. Sci. 3 B
Most colleges use the scale: A = 4, B = 3, C = 2, D = 1, F = 0. To compute Joe's GPA, we multiply each course grade (converted to the number equivalent) by the course credits, then divide the sum by the total number of credits: COURSE CR GR Calculus 4 C 4*2 = 8 Discr. Math 3 A 3*4 = 12 English Lit. 3 A 3*4 = 12 Chemistry 4 D 4*1 = 4 Comp. Sci. 3 B 3*3 = 9 ---- ---- 17 45 GPA = 45 / 17 = 2.65
Example:Grades are often computed using a weighted average. Suppose that homework counts 10%, quizzes 20%, and tests 70%.If Pat has a homework grade of 92, a quiz grade of 68, and a test grade of 81, then find Pat’s overall grade Pat's overall grade = (0.10)(92) + (0.20)(68) + (0.70)(81) = 79.5
Homework • Pg. 117, 118 #12-15, 26-30 For 12-15 find mean, modal class, and median interval


