Download
1 / 16
160 likes | 247 Vues
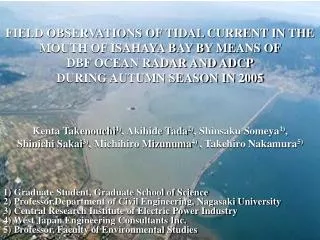
IN SITE MEASUREMENTS OF TIDAL CURRENT AND WATER QUALITY DURING SUMMER SEASON ,2004 IN ISAHAYA BAY. Shinsaku Someya* , A.Tada, T.Nakamura, S.Yano, M.Takeda, A.Hashimoto. * Graduate Student, Graduate school of Science and Technology. Fukuoka. Takezaki Island. Saga. Oita. Isahaya Bay.

E N D
IN SITE MEASUREMENTS OF TIDAL CURRENT AND WATER QUALITY DURING SUMMER SEASON ,2004 IN ISAHAYA BAY Shinsaku Someya* , A.Tada, T.Nakamura, S.Yano, M.Takeda, A.Hashimoto * Graduate Student, Graduate school of Science and Technology
Fukuoka Takezaki Island Saga Oita Isahaya Bay Ariake Sea Nagasaki Kumamoto Miyazaki Kojiro Kagoshima N Sea-dyke 5km 50km 1. Location of Isahaya Bay
Honmyo River Regulation pond Isahaya Bay Sea-dyke 2. Outline of Big National Project of Isahaya Bay ■ Big National Project of Isahaya Bay Purpose: Disaster prevention and land reclamation Start of Constructing : 1989 Main construction : ① Sea-dyke : about 7 km in length ② Reclamation by drainage: ・ Land development・・・about 1,800 ha ・ Regulation pond・・・about 1,700 ha
3. Background of This Study ■In Isahaya Bay,a big project that consists of the construction of sea-dyke and reclamation by drainage is now going on. ■ These caused severe environmental problems such as a change current, eutrophication, oxygen depression and so on. ■In this study, therefore, in situ measurement of both tidal current and water quality in Isahaya Bay were carried out during summer season in 2004. Moreover, the relationship among red tide,anoxic bottom water and the hydrodynamic properties of tidal current is treated according to obtained results.
4. Outline of Field Observation (1) ■Three kind of observation method The current observation using ADCP (Acoustic Doppler Current Profiler) The vertical distributions of various water quality indexes Observation of transparency,wind velocity and wind direction Long-term successive observation on tidal current,Dissolved Oxygen and turbidity
Start time of observation 6 7 5 8 Sea level(cm) Time 9 4 1 3 2 4. Outline of Field Observation (2) ■ The current observation using ADCP (Acoustic Doppler Current Profiler) In order to reveal a three dimensional structure of tidal currents during neap tide in Isahaya Bay, the current observation using ADCP was performed on the 8th of August in 2004. The E-E’ Line(about 9km in length) The I1-I1’ Line(about 8km in length) The I2-I2’ Line(about 6.5km in length) Current measurements were collected 9 times during one tidal cycle. Sea level difference:2.5m
4. Outline of Field Observation (3) ■The vertical distributions of various water quality indexes The vertical distributions of water temperature, salinity, Dissolved Oxygen(DO), pH and so on were measured by using two instruments (YSI6600 and ALEC Model-ACL1183PDk). ■ Observation of transparency,wind velocity and wind direction These observations were carried out abreast of current observation using ADCP at 20 measurements points(St.P1~St.P5, St.Q5~St.Q7, St.a1~St.f1 and St.a2~St.f2).
4. Outline of Field Observation (4) ■ Long-term successive observation on tidal current, Dissolved Oxygen and turbidity A long term successive measurements on vertical profiled of tidal current velocity, DO, and turbidity was carried out . Observation points St.A St.B St.Q7 Observation period:2004/7/24~2004/9/11
2m below the seabed 7m abovethe seabed On the seabed 5. Results and Discussion (1) ■ Tidal current ellipse at St.Q7 The major axis of M2 tidal ellipse in a trench corresponds to its direction dug, namely the direction of NE-SE. The water depth measured currents becomes shallower, its major axis turns more clockwise so that it has shifted to the direction of WNW-ESE near the surface layer.
5. Results and Discussion (2) ■ Horizontal distribution on velocity vectors of tidal current in surface layer (2m below the water surface) It is obvious that the maximum velocity at max. flood current and at max. ebb current occur near an offshore where is about 2km out from Kojiro and Saigo, respectively. The characteristic of flows in Isahaya Bay has the premdominant tidal currents along the north coastline of the Shimabara Peninsula.
5. Results and Discussion (3) ■ Horizontal distribution on velocity vectors of tidal current in surface layer(The 7th ADCP observation) On the north side of the E-E’ Line, the currents were to the south-west toward the bay head as shown in the right figure but the velocity magnitude is too small. during ebb tide(15:00)
Water depth(m) Water depth(m) Konagai distance(km) Saigo Takezaki Is. Kojiro distance(km) I1-I1’line E-E’line 5. Results and Discussion (4) ■ Vertical structure of tidal currents(The 7th ADCP observation) The inflow into Isahaya Bay occurred in the northern part of the E-E’ Line and I1-I1’ Line. These tidal currents were not observed by the field observations in Isahaya Bay during summer in 2002 and in 2003.
) Trouble 5. Results and Discussion (5) ■ Temporal change in vertical distributions of water temperature and Chl-a in Isahaya Bay at low water Water Depth(m) Water Depth(m) Water Depth(m) From these figures, seawater with high temperature and high Chl-a isn’t found out. P5 P2 P3 P2 P1 d1 c1 b1 a1 d2 c2 b2 c2 Takezaki Is Kojiro Konagai Saigo Yue Mizuho Water temperature at low water(7:30) Water Depth(m) Water Depth(m) P5 P2 P3 P2 P1 d1 c1 b1 a1 Takezaki Is Kojiro Konagai Saigo Chl-a at low water(7:30)
5. Results and Discussion (6) ■ Temporal change in vertical distributions of water temperature and Chl-a in Isahaya Bay at the maximum flood current Water Depth(m) Water Depth(m) Water Depth(m) On the other hand, seawater with high water temperature appears in the surface layer near St.P5(Takezaki Is.) and St.d1(Konagai) .Moreover, the value of Chl-a near both points increases significantly. P5 P2 P3 P2 P1 d1 c1 b1 a1 d2 c2 b2 c2 Takezaki Is Kojiro Konagai Saigo Yue Mizuho Water temperature at max. flood current (10:30) Water Depth(m) Water Depth(m) Water Depth(m) P5 P2 P3 P2 P1 d1 c1 b1 a1 d2 c2 b2 c2 Takezaki Is Kojiro Konagai Saigo Yue Mizuho Chl-a at max. flood current (10:30)
6. Conclusion in This Study ■ Tidal current along the north coastline of the Shimabara Peninsula is dominant in Isahaya Bay. ■ There is inflow into Isahaya Bay from Ariake Sea near Takezaki Island in the best part of one tidal cycle. ■It is obvious that the high concentration of Chlorophyll-a is consistent with waters where the red tide was observed on the very day of current observation.
Thank you very much for your kind attention!!