Download
1 / 37
370 likes | 484 Vues
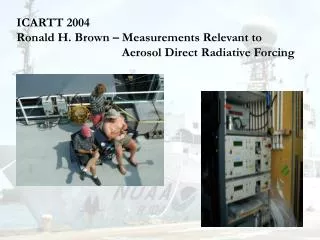
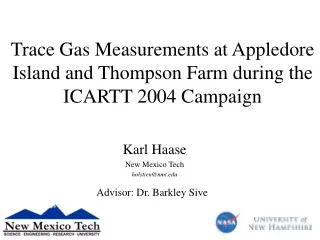
Measurements at Thompson Farm and Appledore Island during the ICARTT 2004 Summer Campaign. Barkley C. Sive University of New Hampshire Institute for the Study of Earth, Oceans, and Space Climate Change Research Center March 30, 2005. SCIENTIFIC MOTIVATION.

E N D
Measurements at Thompson Farm and Appledore Island during the ICARTT 2004 Summer Campaign Barkley C. Sive University of New HampshireInstitute for the Study of Earth, Oceans, and SpaceClimate Change Research CenterMarch 30, 2005
SCIENTIFIC MOTIVATION • What are the processes controlling air quality in the region? • What is the relative contribution of long-range versus more • local pollution sources? • What is the impact of marine derived trace gases and aerosols • on air quality in New England? • What is the impact of extensive natural emissions in New • England on air quality? • How is regional climate changing? • How are seasonal climate and air quality linked?
AMS Measurements at Thompson Farm High organic, low sulfate event Evidence for Alaskan wildfires Large Sulfate and Organic Loadings Acidic Sulfate Highly processed organics R. Griffin
Balloon #2 Flight Track – July 20 Surface O3, ppbv R. Talbot
f = jNO2[NO2]/kNO-O3[NO][O3] Consistent Deviation from PSSA R. Griffin
f = jNO2[NO2]/kNO-O3[NO][O3] Example of Deviation PSSA Agreement Over prediction of ozone when not in PSS R. Griffin
General Distributions at Thompson Farm and Appledore Island Thompson Farm Appledore Island
Pollutant Outflow at Appledore Island Back-Trajectories Clean Period 8am EDT 7/15/04 Polluted Nocturnal Period 9pm EDT 7/15/04
Pollutant Outflow at Appledore Island Appledore Island
Pollutant Outflow at Appledore Island A. Pszenny
Diurnal Cycles at Thompson Farm Ozone peaks in the late afternoon Ozone regulary drops to zero July 1 to August 15, 2004
Diurnal Cycles at Thompson Farm July-August, 2004
Diurnal Cycles at Thompson Farm July-August, 2004
Diurnal Cycles at Appledore Island DOAS NO3 data J. Stutz - UCLA
Acknowledgements AIRMAP Investigators Robert Talbot – Director Ruth Varner Rob Griffin Alex Pszenny Huiting Mao Graduate Students Yong Zhou – UNH Rachel Russo – UNH Carsten Neilsen – UNH Asako Enomoto – UNH Justine Kombarakkaran – NMT Marguerite White – UNH Pieter Beckman, Kevan Carpenter – Technician Laura Cottrell – Research Scientist Don Troop, Yuanli Wang – Engineering Undergraduates Jesse Ambrose – UNH Karl Haase – NMT Patrick Veres – OSU Lissa C.M. Ducharme – Data Reduction Hilary Graves – High School (MA) Kate Petzak – High School (ME) Appledore Island Crew Jochen Stutz – UCLA Bill Keene – UVA Lynn Russell – UCSD Roland von Glasow - Heidelberg Oliver Wingenter – NMT Don Blake – UCI Kevin Gervais – UCI
Appledore Island Measurement Comparison Acetic Acid Comparison of PTR-MS and mist chamber data from Keene and Pszenny Note: The PTR-MS was sampling from a 100 ft x 3/8 in. O.D. PFA Teflon line with a residence time of 2 seconds. The MC/IC was sampling from the roof.
Appledore Island Measurement Comparison slope = 0.98 R2 = 0.92 slope= 1.01 R2 = 0.95 slope = 1.54 R2 = 0.92