Download
1 / 1
20 likes | 163 Vues
SA13A-1879. How Chapmanlike is the Ionosphere of Mars?.

E N D
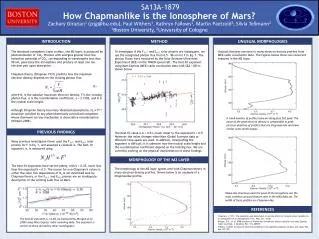
SA13A-1879 How Chapmanlike is the Ionosphere of Mars? To investigate if the F10.7 and E10.7 solar proxies are inadequate, we use the integrated photon flux from 0.5 – 90 nm for F in Eq. 1. The photon fluxes were measured by the Solar Extreme Ultraviolet Experiment (SEE) on the TIMED spacecraft. The best-fit exponent using Mars Express (MEX) radio occultation data with SZA < 80o is shown below. The best-fit value is k = 0.53, much closer to the expected k = 0.5. However, the value changes when Mars Global Surveyor data or different time-spans are used. In addition, interpreting the exponent is difficult; it is unknown how the neutral scale height and the recombination coefficient depend on the ionizing flux. We are currently working on the physical interpretation of these findings. MORPHOLOGY OF THE M2 LAYER Zachary Girazian1 (zrjg@bu.edu), Paul Withers1, Kathryn Fallows1, Martin Paetzold2, Silvia Tellmann2 1Boston University, 2University of Cologne Many previous investigators have used the F10.7 and E10.7 solar proxies for F in Eq. 1, and assumed a constant α. The best-fit exponent, k, is measured using The best-fit exponents have varied widely, with k ≈ 0.35, much less than the expected k = 0.5. The reason for non-Chapman k values is either the solar flux dependence of Nois not described well by Chapman theory, or the F10.7 and E10.7 proxies are an inadequate description of the ionizing solar flux at Mars. PREVIOUS FINDINGS The morphology of the M2 layer agrees well with Chapman theory in many electron density profiles. Shown below is an example of a Chapmanlike profile. The dominant ionospheric layer at Mars, the M2 layer, is produced by photoionization of CO2. Photons with energies greater than the ionization potential of CO2, corresponding to wavelengths less than 90 nm, penetrate the atmosphere and produce at least one ion-electron pair upon absorption. Chapman theory (Chapman 1931) predicts how the maximum electron density depends on the ionizing photon flux. (1) where No is the subsolar maximum electron density, F is the ionizing photon flux, α is the recombination coefficient, e = 2.7182, and H is the neutral scale height. Although Chapman theory has many idealized assumptions, No ∝ F0.5should be satisfied by any photochemically controlled ionosphere whose dominant ion loss mechanism is dissociative recombination (Withers 2009). UNUSUAL MORPHOLOGIES Unusual features are seen in many electron density profiles from MEX radio occultation data. The figures below show two recurrent features in the M2 layer. REFERENCES Chapman, S. 1931. The absorption and dissociative or ionizing effect of monochromatic radiation in an atmosphere on a rotating earth. Proc. Phys. Soc. 43 26. Morgan, D.D., et al. 2008 Variation of the Martian ionospheric electron density from Mars Express radar soundings. J. Geophys. Res. 113, A09303 Withers, P. 2009. A review of observed variability in the dayside ionosphere of Mars. Adv. Space Res , 44s, 277-307. INTRODUCTION METHOD A small number of profiles have an elongated, flat peak. The value of the peak electron density is comparable to peak electron densities of profiles that are Chapman-like and have similar solar zenith angles. Wave-like structures near the peak of the ionosphere are the most common unusual feature seen in the MEX data set. The width of these profiles are Chapman-like. The best-fit exponent, k = 0.30, as measured by Morgan et al. 2008 using Mars Express radar sounding data. The exponent is similar to those derived by other investigators.