Optical and Terahertz Spectroscopy of CdSe/ZnS Quantum Dots
This study investigates the electronic and vibrational properties of CdSe/ZnS core/shell quantum dots using optical and terahertz (THz) spectroscopy techniques. Utilizing temperature-dependent photoluminescence, we observe changes in emission energy and intensity, elucidating phonon coupling behaviors that vary with temperature. Additionally, linear THz spectroscopy reveals carrier transitions and acoustic phonon behaviors in the quantum dots. The research highlights the potential applications of these quantum dots in fields ranging from biological imaging to photovoltaic cells and underscores the importance of their size and matrix in determining optical characteristics.

Optical and Terahertz Spectroscopy of CdSe/ZnS Quantum Dots
E N D
Presentation Transcript
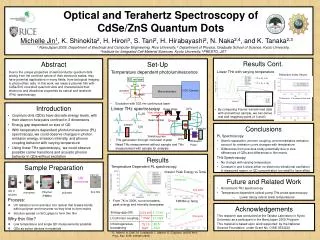
Optical and Terahertz Spectroscopy of CdSe/ZnS Quantum Dots Michelle Jin1, K. Shinokita2, H. Hirori3, S. Tani2, H. Hirabayashi2, N. Naka2,4, and K. Tanaka2,3 1 NanoJapan 2009, Department of Electrical and Computer Engineering, Rice University, 2 Department of Physics, Graduate School of Science, Kyoto University, 3Institute for Integrated Cell-Material Sciences, Kyoto University, 4PRESTO, JST Abstract Results Cont. Set-Up Temperature dependent photoluminescence Linear THz spectroscopy Linear THz with varying temperature Due to the unique properties of semiconductor quantum dots arising from the confined nature of their electronic states, they have potential applications in many fields, from biological imaging to photovoltaic cells. In this work, we made a polymer film with CdSe/ZnS core/shell quantum dots and characterized their electronic and vibrational properties by optical and terahertz (THz) spectroscopy. Refractive Index Values • ñ = n + iκ • ε = ε1+ iε2 532 nm laser ˜ CCD Camera lens Monochromator cryostat sample Dielectric Constant Values • Excitation with 532 nm continuous laser • Introduction • Quantum dots (QDs) have discrete energy levels, with their electron-hole pairs confined in 3 dimensions • Energy gap dependent on size of QD • With temperature dependent photoluminescence (PL) spectroscopy, we could observe changes in photon emission energy, emission intensity, and phonon coupling behavior with varying temperature • Using linear THz spectroscopy, we could observe possible carrier transitions and acoustic phonon behavior in QDs without excitation ZnTe Delay stage • By comparing Fourier transformed data with and without sample, we can derive real and imaginary parts of ñ and ε Near infrared Eref(t) ˜ THz Beam splitter Chopper sample • Conclusions • PL Spectroscopy • Atomic separation, phonon coupling, and nonradiative emission account for emission curve changes with temperature • Differences from previous study potentially due to size differences of QDs and differences in film matrix • THz Spectroscopy • No change with varying temperature • Constant n and k show either no electronic/vibrational oscillation in measured region, or QD concentration too small to have effect Es(t) Detector λ/4 Sampling pulse ZnTe • THz generation through nonlinear crystal • Need THz measurement without sample and THz measurement with sample for analysis Wollaston Prism Results • Sample Preparation • Process: • UV radiation turns activator into radical that breaks bonds within polymer and monomer so they bind to form matrix • Solution spread on SiO2 glass to form thin film Why thin film? • Low temperature and single QD measurements possible • QDs as active devices in materials Temperature Dependent PL spectroscopy Emission Peak Energy vs Temp 9.65 mm UV + + • Future and Related Work • Broad band THz spectroscopy • Temperature dependent optical pump THz probe spectroscopy • Lower decay rate at lower temperatures + reference* this work QD in toluene thin film Polymer (PMMA) activator monomer • From 7K to 300K, curve broadens, peak energy and intensity decreases FWHM vs Temp Acknowledgements This research was conducted at the Tanaka Laboratory in Kyoto University as a participant in the NanoJapan 2009 Program This material is based upon work supported by the National Science Foundation under Grant No. OISE‐0530220 reference* Energy gap (0K) 2.13 eV 2.03 eV this work 7 meV 21 meV LO phonon coupling Inhomogeneous broadening 85.5 meV 75.13 meV *D. Valerini, A. Cretí, M. Lomascolo, L. Manna, R. Cingolani, and M. Anni, Phys. Rev. B 71, 235409 (2005)