Download
1 / 46
460 likes | 575 Vues
Explore non-linear resonance models in black hole binaries, observational manifestations, and comparison with neutron star sources. Analyze QPOs and black hole spin estimation. Discuss unique microquasars like Circinus X-1 and GRS 1915+105.

E N D
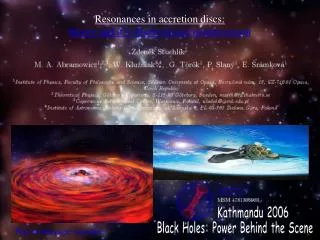
Resonances in accretion discs: theory and it’s observational manifestation Kathmandu 2006 Black Holes: Power Behind the Scene Figs on this page:nasa.gov
Outline Presentation download: www.physics.cz/research in sect. news 1. Introduction:Quasi-periodic oscillations (QPOs) - Black-hole and neutron star binaries, accretion disks and QPOs 2. Non-linear resonance models 2.1. Orbital resonance model 2.2. Few general properties of non-linear resonances 3. Black-hole observations 3.1. Microquasar data: the 3:2 phenomenon, 1/M scaling 3.2. Estimating the black hole spin 3.3. Supermassive black holes 4. Comparison with neutron-star sources 4.1. Frequency – frequency fits (Bursa lines) 4.2. The slope-shift anti-correlation and prediction of black-hole Bursa lines 4.3. Evolution of RMS amplitudes across the resonance point 5. Bonus 1: 13th source (a remark about the peculiar microquasar Circinus X-1) 6. Bonus 2:Aschenbach effect and GRS 1915 + 105 7. References
1. Basic introduction: Quasiperiodic oscillations in X-ray Figs on this page:nasa.gov
1.1.Black hole binaries and accretion disks radio “X-ray” and visible Figs on this page:nasa.gov
1.2.X-ray observations Light curve: I t Power density spectra (PDS): Power Frequency Figs on this page:nasa.gov
1.3.Quasiperiodic oscillations power hi-frequency QPOs low-frequency QPOs frequency
2. Non-linear resonance models Figs on this page:nasa.gov
2.1. Orbital resonance model in general relativity, all the three frequencies depend on generic mass as f ~ 1/M
2.1.1. Resonance of epicyclic frequencies (a particular non-linear resonance) Parametricresonance: ! frequencies are in ratio of small natural numbers [e.g, Landau & Lifshitz, 1976], which must hold also in the case of forced resonances Epicyclic frequencies depend on generic mass as f ~ 1/M.
2.1.1. Resonance of epicyclic frequencies (a particular non-linear resonance) Parametricresonance: lensing simulation by Bursa 2004 frequencies are in ratio of small natural numbers [e.g, Landau & Lifshitz, 1976], which must hold also in the case of forced resonances Epicyclic frequencies depend on generic mass as f ~ 1/M.
2.2. Few properties of non-linear oscillators • The 1/M scaling in epicyclic model follows from nature of Keplerian motion. On the other hand, frequencies in ratio of small natural numbers come from general properties of non-linear oscillators and have nothing to do with particular choice of resonant frequencies. • One can check more general properties of non-linear resonances.
2.2.1. Few properties of non-linear resonance models Well defined predictions • Of particular epicyclic model: • 1/M scaling • Preferred 3:2 ratio (Horák 2004) • Of non-linear resonances: • Eigenfrequencies in ratio of small natural numbers (Landau&Lifshitz, 1974) (Abramowicz etal., 2005/6,Török etal. 2006) • Lines in n-n plane: • Their anticorrelation:
3. Black-hole hi-frequency QPOs Figs on this page:nasa.gov
3.2.Estimating the black hole spin Török, Abramowicz, Kluzniak, Stuchlík 2005
3.2.1.Example of estimates for 3:2 resonance Note that for the fixed model the spin values can not much differ between the three microquasar sources as the observed frequencies scales roughly as 1/M. (green line corresponds to the best fit by 1/M)
3.2.2.Estimating the spin - results Summary of angular momentum estimates from several resonances: Except for one case, all the resonances considered in Török et al. (2005) are consistent with reasonable values of the spin covering the range (-1,1). In particular, the 3:2 epicyclic parametric (internal) resonance model, supposed to be the most natural one in Einstein gravity (Horák 2004) implies the spina~ 0.9.
3.2.3.Troubles with the spin Summary of angular momentum estimates from 3:2 resonances: For the fixed model the spin values can not much differ between the three microquasar sources as the observed frequencies scales roughly as 1/M. The most recent angular momentum estimates from fits of spectral continua (McClintock et al., 2006): GRO 1655-40 a ~ (0.65 - 0.75) GRS 1915+105 a > 0.98 The spectral limits to the spin for the two microquasars are very different. Hence, if the spin values obtained from the spectral fits are correct, the observed high frequency QPOs do not show sensitivity to the spin a under the assumption of a unified QPO model.This is a serious problem for any relativistic orbital QPO model (i.e., model handling with the orbital and epicyclic frequencies).
3.2.4.Estimating the spin - requirement of a more realistic description ? It was found recently that the pressure effects may have a strong influence on the oscillation frequencies (Šrámková 2005, Blaes et al. 2006). For non-slender tori within Newtonian theory and the Paczynski-Wiita potential, the epicyclic frequencies decrease with increasing thickness of the torus. The same behaviour was found for the resonant radius where the frequencies are in a 3:2 ratio, which on the contrary implies it increase of the resonant frequencies.
3.2.4.Estimating the spin - requirement of a more realistic description ? Considering the appropriate corrections to frequencies in the Kerr metric, one can reestimate the spin. If the results in the Kerr metric were following the same trend as those in the Paczynski-Wiita case, the spin for some configurations can be it lower than previously estimated. In case of the 3:2 parametric resonance, the maximal realistic increase of the resonant frequency due to the pressure effects is about 15 percent which for GRO 1655-40 and the mass estimate by Beer & Podsiadlowski would lower the spin down to a ~ 0.8.
3.3.The 3:2 ratio and 1/M scaling – supermassive black holes Background:nasa.gov
4. Neutron-star hi-frequency QPOs Figs on this page:nasa.gov
4.1. Frequency – frequency fits kHz frequency – frequency relation for low mass X-ray binaries NS BH
4.1. Frequency – frequency fits Psaltis et al. 1998
4.1. Frequency – frequency fits Bursa 2002: NS are far away from n2 = 1.5n1, f-f relations differ for individual sources
4.2. Slope-shift anti-correlation The coefficients of linear fits for twelve neutron-star sources are anticorrelated[Abramowicz et al. 2006]
4.2. Slope-shift anti-correlation The coefficients of linear fits for twelve neutron-star sources pointed to the eigenfrequency ratio equal to3/2. Two weakly coupled oscillators with eigenfrequency ratio A^0: From the data for 12 sources, The exact value of the shift coefficient is 625 Hz and relation reads A = 1.5 – 0.0016B
4.2. Slope-shift anti-correlation: prediction for black holes Both the black hole and neutron star QPOs shows the 3:2 ratio pointing to a resonance. The 1/M scaling indicating the orbital origin of hi-frequency QPOs holds /at least roughly/. The neutron star hi-frequency QPOs forms anticorrelated lines in frequency-frequency plane as predicted from the assumtion of non-linear weakly coupled oscillations. On the other hand, the black hole (microquasar) hi-frequencies seems to be rather fixed….
4.2. Slope-shift anti-correlation: prediction for black holes The observed upper and lower QPOs frequencies are linearly correlated along the "Bursa lines" in both, neutron star and black hole sources ? - theory predicts that the resonance range for the black holes sources may be much smaller than for the neutron star sources. For this reason, all the data points for black hole sources are very close to one "resonance point", in which observed frequencies are close to the exact 3:2 ratio. We predict that more accurate future observations will resolve the small resonance ranges and reveal the black hole Bursa lines:
4.2. The rms amplitude evolution across the resonance point The rms amplitude = percentual fraction (root mean square fraction)of the peak energy with the respect to the total countrate, the rms amplitude indicates the energy connected to the observed oscillations. Power Frequency
4.2. The rms amplitude evolution across the resonance point For the three atoll sources, the difference of lower and upper rms amplitudes changes its sign when the source pass the 3:2 ratio. (“Török energy switch”) The case of 4U 1636: When the ratio between upper and lower frequency is higher then 3:2, the upper oscillation is stronger. For the ratio of frequencies equal to 3:2, both oscillations have the same amplitudes. When the ratio between upper and lower frequency is lower then 3:2, the lower oscillation is stronger.
4.3. The rms amplitude evolution across the resonance point “The energy switch” in three atoll sources: When the ratio between upper and lower frequency is higher then 3:2, the upper oscillation is stronger. For the ratio of frequencies equal to 3:2, both oscillations have the same amplitudes. When the ratio between upper and lower frequency is lower then 3:2, the lower oscillation is stronger. (Török, Barret, 2006 in prep.) Török curve
6. Bonus 1: 13th source A remark about the peculiar microquasar Circinus X-1 Fig. on this page:nasa.gov
6. The case of Circinus X-1 Tvelwe neutron sources (the six shown here plus six other sources) are within the observational errros consistent with the relation A = 1.5 – 0.0016B. Boutloukous et al. (2006) have measured double peak QPOs clearly inconsistent with this relation:
6. The case of Circinus X-1 It was first mentioned in the context of QPOs by Abramowicz & Kluzniak (2001) that in the case of a forced resonance the combinational frequencies can appear in observation. As noticed by Boutloukous et al. (2006), the observed frequency relation closeto3:1 can follow from a 3:2 resonance.
6. The case of Circinus X-1 The frequency relation close to 3:1 can follow from 3:2 resonance if the Cir X-1 resonant frequencies and the connected observed frequencies relate as and then
6. The case of Circinus X-1 The observed frequency relation close to 3:1 could follow from 3:2 resonance:
6. The case of Circinus X-1:13th source The slope-shift anticorrelation A = 1.5 – 0.0016Bfor 12+1 sources.
7. Bonus 2: Aschenbach effect Aschenbach effect, humpy LNRF-velocity profiles, its possible relation to QPOs and application in GRS 1915+105
6. References • Török, Abramowicz, Kluzniak, Stuchlík • 2005, A&A, 436, p. 1, www.physics.cz/research • Török, Abramowicz, Stuchlík, Šrámková, • 2006, proc. of IAU meeting, astro-ph/0610497 • Török, Abramowicz, Kluzniak, Stuchlík • 2006, proc. of Albert Einstein Conf. Paris 2005, astro-ph/0603847 • Horák, 2004, proc. of RAGtime 5, download: ADS • Abramowicz, Barret, Bursa, Horák, Kluzniak, Olive, Rebusco, Török, • 2006, proc. Of RAGtime 2005, download: ADS or www.physics.cz/research • Abramowicz, Barret, Bursa, Horák, Kluzniak, Olive, Rebusco, Török • 2006, submitted to MNRAS • Lachowicz, Czerny & Abramowicz (2006), astro-ph/0607594 • Boutloukous et al., 2006, astro-ph/0608089, ApJ, submitted • Stuchlík, Török, Slaný, Abramowicz, 2005, Physical Review D, 71 • Stuchlík, Slaný, Török, 2006, proc. of RAGtime, in ADS Presentation download: www.physics.cz/research in sect. news