Download
1 / 16
160 likes | 292 Vues
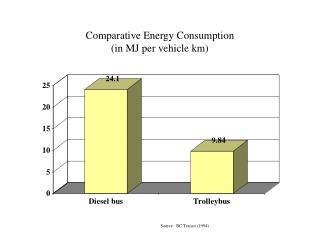
Comparative Energy Consumption (in MJ per vehicle km). Source: BC Transit (1994). Description of Transportation Emissions. Diesel Exhaust is a complex mixture of hazardous particles and vapors, some of which are known carcinogens and other probable carcinogens.

E N D
Comparative Energy Consumption (in MJ per vehicle km) Source: BC Transit (1994)
Diesel Exhaust is a complex mixture of hazardous particles and vapors, some of which are known carcinogens and other probable carcinogens. The US Environmental Protection Association (California) has identified 41 substances in diesel exhaust listed by the State of California as” toxic air contaminants”. A “toxic air contaminant”is defined as an “air pollutant which may cause or contribute to an increase in mortality or in serious illness, or which may pose a present or potential hazard to human health”. In addition to, or as part of the commonly referred to emissions of NOx, CO and particulate matter produced by diesel engines, the substances listed at the left have been identified. The immediate health threat posed by the use of diesel engines in transit buses arises from the fact that the toxic emissions are released directly into the streets--right into the airways of pedestrians and transit patrons waiting at bus stops. Studies of emissions from co-called ‘clean’ diesel engines reveal that, while NOx and CO levels may be lower, the levels of toxins such as dioxins, benzene, toluene, 1,3-butadiene and PAH’s is essentially unchanged. While the weight of the particulate matter is reduced substantially, the total number of particles emitted by ‘clean’ diesel engines is 15 to 35 times greater than by conventional diesels. The particles are simply finer, not fewer. Finer particles are more likely to penetrate deeper into the lungs, where they would be trapped and retained. Toxins identified in Diesel Exhaust by the EPA Sources: Natural Resources Defense Council (1998), US Environmental Protection Association.
Toxic Air Contaminant Emissions by Mode/Power Source(in g/km) Data Sources: ETS (1993), TransLink (1999), Edmonton Power (1993)
Total Toxic Air Contaminant Emissions per Million Kilometresin Vancouver (in tonnes) Toxic Air Contaminants include Hydrocarbons, Carbon Monoxide, Oxides of Nitrogen, Sulphur Oxides, Particulate Matter. Data Sources: TransLink (1999)
Comparative Maximum Levels of Toxic Air Contaminants by Mode (in g/km) Sources: NAAVC (1999), Edmonton Power (1993), TransLink (1999). NAAVC figures based on tests using CBD cycle
Greenhouse Gas Emission Trends(in g/km of CO2e*) Larger, more powerful diesel engines tend to result in a slight increase in the average CO2 emission levels from diesel powered transit buses. On the other hand, the trolleybus, powered by hydroelectric power, does not contribute any greenhouse emissions to the environment. *CO2 Equivalent – includes greenhouse gas values for emissions of CO, NOx, N2O, CH4. Data Sources: ETS (1993),, NAAVC
Estimated Greenhouse Gas Emissions per Kilometre in 2005 by Mode(in grams/km of CO2e) Sources: TransLink.
Comparative Noise Levels by Mode(in decibels) • Hearing loss occurs at levels of 90 db or higher • The electric trolley measures around 175 times quieter than the diesel bus • A Philadelphia study showed that the passing of a trolleybus could not be heard above the ambient street noise Adapted from Coast Mountain Bus Company (Vancouver); KC Metro (Seattle).
Trolley Bus Benefits . . . Trolley Coaches attract Riders OTHER CITIES OPERATING TROLLEY COACHES REPORT RIDERSHIP INCREASES IN THE 10% TO 15% RANGE SF MUNI - Conversion of No. 1 line to trolley completed in 1981: 18% increase in ridership between 1979 and 1982. - No. 3, 4 and 55 lines also converted to trolley in 1982 with increases in patronage of approximately 10% to 15%. - California and Jackson lines temporarily converted from trolley to diesel in 1970’s with a 10% to 15% decrease in ridership. SEATTLE METRO - Approximate 10% increase in ridership when a line is converted from diesel to trolley coach operation. CLEVELAND - Expects to realize at least a 10% increase in ridership with the installation of a trolley bus line along Euclid Avenue early in the present decade. Sources: Booz, Allen & Hamilton, Trolley Bus Study for the RTD and LACTC (1991); San Francisco MUNI, Seattle METRO and Greater Cleveland Regional Transit Authority.
Statements of the Washington Society of Professional Engineerswith regard to trolleybus operations and the replacement of trolleybuses by diesel-powered vehicles - The . . . general belief that the diesel engine is the most efficient and adaptable of all motive units for urban transit vehicles is a modern-day phenomenon that finds a parallel only in such well-known misconceptions of the past as the world is flat! - [A] major function of an urban transit system is to transport patrons to and from the central business district--without strangling it! This cannot be done with the motorbus, particularly the diesel because of the offensive odor and high toxicity of its exhaust. - Subsidizing an all-diesel system is tantamount to subsidizing the motor coach industry and air pollution. - No urban community can afford to use the diesel bus for transit purposes . . . from the standpoint of . . . air pollution and public health. - The complete failure of any type of IC engine in urban transit duty is no fault of the technology, but rather a result of the narrow limits imposed by the laws of physics on the extent to which this type of machine can be improved. Its greatest single reason for failure as a transit unit is the fact that its engine speed must be maintained if its tractive effort and horsepower is, also, to be maintained. By contrast, maximum tractive effort, in the case of the electric vehicle, can be realized without any ‘engine’ speed whatsoever. [In other words, the IC engine is incapable of achieving the energy efficiencies possible with the electric motor.] - The ultimate in poor transit management is the practice of scheduling motorbuses under the wires, when trolleys are left standing idle in the barn. - Those who contend that the cost per mile is meaningful as a method of evaluating equipment either do not have adequate knowledge to express an opinion on the matter, or their motives must be suspect. - Cost of power and maintenance of trolley overhead track and feeder are negligible in the overall costs of operating. The three largest costs, by far, are platform hours, equipment maintenance and garaging and administrative and general expense. Whatever management’s reason for conversion [to diesel], economy of operation and service to the patron have nothing whatsoever to do with it! - Any proposal contemplating the retirement of an efficient trolley coach operation of assured longevity and utility value and the abandonment of its newly constructed substation system not only indicates a lack of moral responsibility to the public and a sister city utility, but also a complete disregard for the realities of economics. (S. M. Shockey) Source: WSPE and Seattle Civic Affairs Committee
Energy Efficiency of Fuel Cell Vehicles Ten units of power produced at a power plant will power: - ten direct electric vehicles ( e.g. trolleybuses) - five lead-acid battery vehicles - one fuel cell vehicle Source: Eur Ing Irvine Bell BSc CEng MIMechE CDipAF PGCE
Energy Requirements and Carbon Dioxide Emissions for a Subcompact Car Fuel cell emissions based on hydrogen generated from natural gas or methanol. Note that fuel cell technology still results in 77% of the CO2 emissions produced by a diesel engine. Sources: Daimler-Benz (1994); Ian Fisher, Electric Trolleybuses in Vancouver, 1997
Fuel Cells and GHG’s Hydrogen needed to power fuel-celled vehicles is most readily obtained by stripping it from hydrocarbon molecules found in fossil fuels. The process results in the release of Carbon Dioxide, the most common greenhouse gas and the key target of the Kyoto Accord. Presently, fuel cells would result in little reduction in greenhouse gases over internal combustion engines. The chart below quantifies the greenhouse gas emissions produced in operating a Mercedes A-class automobile with different power sources: Total Greenhouse Gas Emissions per 1,000 km (in kg of CO2e) Source: The Economist (April 2000); Pembina Institute for Appropriate Development