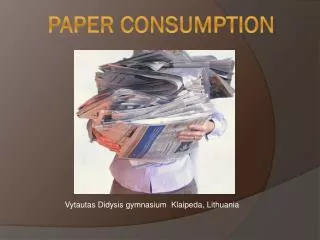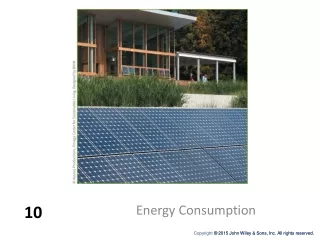
Consumption
Consumption. The Coffee Cup Debate. The average ceramic mug requires 25.5 times more energy to make than the average paper cup—14 mega Jules (MJ) versus 0.55 MJ per cup.

Consumption
E N D
Presentation Transcript
The Coffee Cup Debate • The average ceramic mug requires 25.5 times more energy to make than the average paper cup—14 mega Jules (MJ) versus 0.55 MJ per cup. • The embedded energy disparity is even greater with foam cups, 14 MJ compared to 0.20 MJ per cup—that’s a difference of 700 percent. Break-even point?
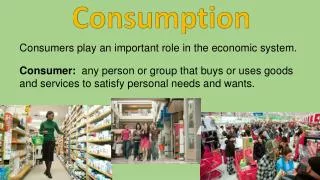
Recycling is “green”…relative to what? 3 Rs of environmentalism: Reduce, Reuse, and Recycle.
Extended Producer Responsibility Designing products that can actually be recycled
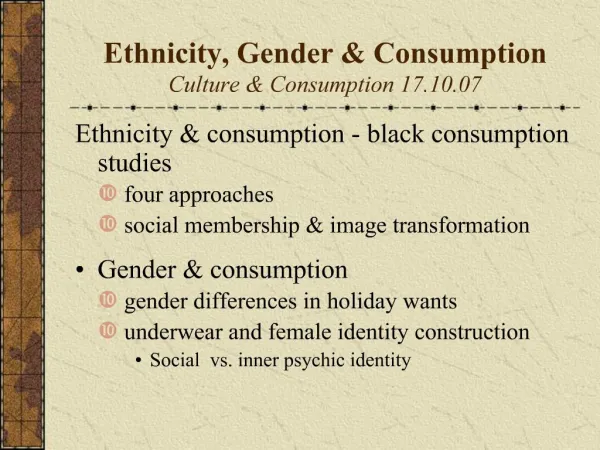
Sociology of Consumption • Social comparison • Conspicuous consumption • Identity • Specialization • Sociotechnical systems • Planned obsolescence
Carrotmob Buycott vs. Boycott http://vimeo.com/925729 Since 2008, carrotmobs have spread to 10 other US cities and Finland and France.
The past: nonmarket coordination of large groups of people from around the world for purposes of resource allocation too difficult. • Today: new forms of social media have greatly reduced these barriers. Collaborative Consumption
Peer-to-Peer Renting • Peer-to-peer sites that create a low-transaction cost environment are allowing a type of “commons” to appear. • For instance, irent2you.com, rentmineonline.com, and iletyou.com • Estimated that if the United States shifted a fifth of its household spending from purchasing to renting, the country would cut CO2 emissions by roughly 2 percent (or 13 million tons) annually.
Car Sharing (Rent and Peer-to-Peer)“Low-Car Diet Challenge”http://vimeo.com/33442883 • Surveyed after the challenge • Reduced vehicle miles travelled by 66 percent • Increased the miles walked and biked by 93 percent and 132 percent, respectively • Almost half of the participants reported losing weight. • Perhaps most importantly, 61 percent said they planned to continue with their new transportation habits.
Zip Car • Average car users save an estimated US$600 a month and reduce vehicle miles traveled by 44 percent when they switch to car sharing. • When people share cars they begin to realize they don’t actually need them as much as they once thought. • In some markets, every car-sharing vehicle takes up to eight owned vehicles off the road.
The rebound effect: when increases in efficiency reduce total resource consumption but not in full proportion to the efficiency improvement. • For example, when a 20 percentgain in efficiency leads to reduction in consumption or waste by only 10 percent • When the effect is more than 100 percent of the efficiency gain it is a Jevons paradox. • The tendency to reinvest efficiency gains in additional consumption Rebound Effect vs. Jevons Paradox