Census data, the COAG data and spatial analysis Matthew James
270 likes | 428 Vues
Census data, the COAG data and spatial analysis Matthew James. Outline. The COAG targets and Census data Place-based analysis and the Census Analysis that is only possible with the Census. Targets to Close the Gap. To close the gap in life expectancy within a generation;

Census data, the COAG data and spatial analysis Matthew James
E N D
Presentation Transcript
Census data, the COAG data and spatial analysis Matthew James
Outline • The COAG targets and Census data • Place-based analysis and the Census • Analysis that is only possible with the Census
Targets to Close the Gap To close the gap in life expectancy within a generation; To halve the gap in mortality rates for Indigenous children under five within a decade; To ensure all Indigenous four-year olds in remote communities have access to early childhood education within five years; To halve the gap in reading, writing and numeracy achievements for Indigenous children within a decade; To halve the gap for Indigenous students in year 12 equivalent attainment by 2020; To halve the gap in employment outcomes between Indigenous and non-Indigenous Australians within a decade.
Measurement • Life expectancy is measured through both census and mortality data • The under 5 mortality target is measured with mortality data • The Early childhood access target will be measured by a new collection being developed by the ABS but Census data will be important for the denominator • The reading, writing and numeracy targets are measured with NAPLAN data
Measurement • The baseline for the employment target is the NATSISS but the Census is a key source • The main source for the year 12 or equivalent target is the Census as the population group – 20-24 year olds is relatively small which means that survey data has high sampling error • The baseline for the employment target is the NATSISS but the Census is a key data source.
Performance Indicators and the NIRA • There are 27 indicators in the NIRA much more than the targets themselves. Some of these indicators are progress indicators such as smoking rates while others are proxies. • For example, while the life expectancy target can only be directly measured every 5 years – mortality data are available annually
The Census and the NIRA • Of the 27 indicators the census is the main source for 3 - Year 12 attainment target itself - The Proportion of Indigenous 18-24 year olds engaged in full-time employment, education or training at or above Certificate III - The proportion of 20-64 year olds with or working toward post-school qualifications in Cert III or above.
The Census and the NIRA • But estimates of the residential population are denominators for a total of 11 indicators. • The Census is clearly critical for monitoring progress against the COAG targets.
The Census and Small Area data • Much of the focus in Indigenous policy requires data to be split by remoteness area – options for this can be limited with survey data • Importance of local baseline studies - Fahcsia Baseline Community Profiles - Detailed baseline mapping reports for the 29 RSD communities
The Census and Small Area data • For remote Indigenous communities the Census is a key data source but at times the undercount can affect data quality. • Census a key source for local data on employment, educational attainment, the age structure and provides some useful information on mobility • The Census compliments other administrative data including hospitalisation data, school attendance data and NAPLAN data • Without the Census community profiles would be very limited
The Census is critical for time seriesanalysis • The Census is the only real source for long-term time series analysis as the surveys do not go back far enough. • For much analysis you need time series data. • Often trends are only evident over long periods • The term baseline can use to confusion
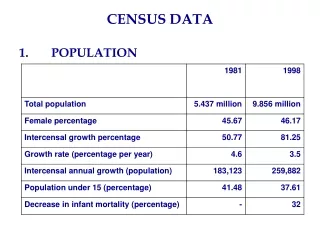
Urbanisation • The proportion of the Indigenous population in population of centres of 1,000 or more has changed massively in the last 40 years • In 1971 just over 44% of the Indigenous population lived in population centres of 1000, or more people • By 2006 this proportion stood at 76% Note these data should not be conflated with data on remoteness area
Why has this happened? • Internal migration • An increasing propensity over time to identify as Indigenous • The so called ‘error of closure’ accounted for 50% of population growth between 1991 and 1996 and 31% between 1996 and 2001 much of this is concentrated in urban areas • For the period 2001 to 2006 the error of closure was small • You cannot understand Indigenous demography without understanding intermarriage patterns. • Births to non Indigenous mothers are important
Pattern more stark if CDEP Excluded Indigenous employment rate by sex
The Employment Gap is low at high education levels, 2006 Census DataEmployment Rate, 15-64
Proportion of Indigenous and Non Indigenous Males with Post-School Qualifications, 1971 to 2006, Age 20-64
Employment Rate, Age 20-64, Males who left School at 14 or Younger
Remoteness area • 75% of the Indigenous population is in non remote areas • But ‘gaps’ usually considerably wider in remote areas • Collectively inner and outer regional areas are more important than the major cities • People conflate remoteness with discrete communities
Indigenous employment rates, age 15-64 by remoteness area, with and without CDEP, 2006
Highest level of Educational Attainment Year 9 or belowby Remoteness Area, Indigenous adults (20-64), 2006
Indigenous male employment rates, 15-641981 and 2006, CDEP counted as employment
Indigenous male employment rates, 15-641981 and 2006, CDEP not counted as employment
Conclusion • Census a key source for the NIRA and the COAG targets • Census critical for place-based analysis • Census allows time series analysis back to 1971 • Census has some other advantages over surveys – for example the inclusion of people in non private dwellings • Surveys complement the Census – we need both