Download
1 / 26
260 likes | 395 Vues
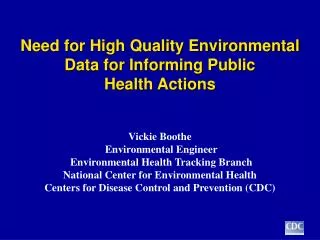
Need for High Quality Environmental Data for Informing Public Health Actions. Vickie Boothe Environmental Engineer Environmental Health Tracking Branch National Center for Environmental Health Centers for Disease Control and Prevention (CDC). Presentation Outline.

E N D
Need for High Quality Environmental Data for Informing Public Health Actions Vickie Boothe Environmental Engineer Environmental Health Tracking Branch National Center for Environmental Health Centers for Disease Control and Prevention (CDC)
Presentation Outline • Environmental Public Health Tracking (EPHT) Program • PHASE Project Collaboration • Use of Models for Air Quality Exposure Assessments • Future Data & Model Improvement Needs • Priority EPHT Data, Methods & Model Needs • Air Toxics • Water Quality • Private Wells • Public Drinking Water Systems
National Environmental Public Health Tracking Program Background
The Future of Public Health(IOM, 1988) “The removal of environmental health authority from public health agencies has led to fragmented responsibility, lack of coordination, and inadequate attention to the health dimensions of environmental problems.”
Pew Environmental Health Commission Environmental Health Review 2001 Report • Environmental health system was inadequate and fragmented • Responsibilities scattered among agencies • Unable to link environmental and health databases Recommended a “Nationwide Health Tracking Network for diseases and exposures”
CDC Defines Environmental Public Health Tracking as… The ongoingcollection, integration, analysis, and interpretation of data about the following factors: • Environmental hazards • Exposure to environmental hazards • Health effects potentially related to exposure to environmental hazards It includes dissemination of information.
Potential EPHT Data Uses(Public Health Actions) • Identify populations at risk; • Respond to clusters, outbreaks, emerging threats; • Identify potential associations; • Guide & evaluate interventions; • Reduce environmental risks; • Develop & disseminate information.
Desirable Characteristics for EPHT Data • Ongoing, Systematic Collection • Nationwide in Scope • Std Collection/Reporting • QA/QC Procedures • Temporal & Spatial Variables • Fine Resolution of Data • Timely Availability • Related to Hazard Exposure
Desirable Characteristics On-going Collection QA/QC Std Collection/Reporting Temporal & Spatial Variables Significant Limitations Spatial Gaps Temporal Gap Ozone Monitors PM 2.5 Monitors Ozone & PM Air Monitoring Data
Health effects of ozone Ozone affects lungs • increases asthma symptoms • reduced lung function • reduced exercise capacity • chest pain and coughing • very young and old affected http://science.howstuffworks.com/ozone-pollution2.htm
What Health Effects Are Associated with PM2.5? • Particles may trigger or cause significant health problems: • coughing and difficult or painful breathing • aggravated asthma, bronchitis, emphysema • decreased lung function • weakening of the heart, heart attacks • premature death Source: Randy E. Mosier, MDE Air Pollution 101
Importance to EPHT- Criteria Air Pollutants, Asthma, & Other Associated Health Outcomes • Hospitalizations increase ~7 to 10 % for a .05 ppm increase in ozone levels(Ozkaynak et al 1996). • Eastern U.S. O3/Respiratory Events in one summer • ~159,000 ED Visits • ~ 50,000 hospitalizations(Abt Associates 2000). • Mortality increases ~2% to 6% for a 25µg/m3 increase in PM2.5 • ~ 60,000 annual sudden cardiac deaths attributed to particulate air pollution (Stone and Godleski 1999). • Public Health Impact Comparison • ~16,371 AIDs related deaths 2002 (CDC 2002) • ~17,524 fatalities from alcohol-related traffic crashes in 1997 (NHSTB 1997).
Ozone Monitors PM 2.5 Monitors
EPA PARTICIPATION IN PHASE Question: Best Method for Generating Air Data Useful for Assessing the Health Status of All Populations? ?
EPA & NOAA Air Quality Characterization Methods Air Quality Monitoring EPA (OAQPS) CMAQ Model EPA, NOAA Kriged Surface EPA (OAQPS) HB Combined Data Surface EPA (ORD), OAQPS, NOAA
EPA CDC WI NYS ME CDC/EPA/State Multi-Disciplinary Collaboration ? • EPHT States Needed • Owners Asthma Data • Responsible PH Actions PHASE Project Do different air quality characterization methods improve capabilities for environmental public health tracking?
Public Health Air Surveillance Evaluation (PHASE) Project Overview • EPA Develops/evaluates air quality characterization methods & data. • States link/analyze daily 2001 Ozone & PM2.5 data with Asthma Data and PM2.5 data with data on Myocardial Infarctions. • Compare results among methods & with scientific literature results. • Evaluation Matrix • Evaluate ease of use of the data • Temporal Resolution • Spatial Coverage • Observe differences between geographic scales • Results Comparison (did more complex method improve PH utility?)
PHASE Results • HB Combined Monitoring & CMAQ Data Set Only AQ Characterization Method adequate for all analyses. CMAQ Data Over-smoothed for PM KrigedCMAQ HB Monitor Kriged Data Over-smoothed for PM Monitor Kriged
PHASE Final Products • Routinely Available Air Characterization Data • Ozone & Particulate Matter • Compatible w/Hosp. Disc. & ED Data • Asthma • Cardiovascular Disease • How to Guide (Cookbook) • Case Definitions • Other Risk Factors • Confounders/Covariates • Analysis Software • Lessons Learned • Scientific & Technical • Multi-Agency, Multi-Disciplined Collaboration VISION – Data & Results Comparable
Monitoring Modeling Satellite PHASE Next Steps: Improving Air Quality Characterization Data Partnerships in Characterizing New Air Quality Data
Captures Natural Event/Disaster Data Wildfires Volcanoes Dust Storms ID Source of Large PM Events Indicator of Exposure Duration Assess Rural Population Exposures Additional Validation Data Points CMAQ Predictions Feedback Improve HB Methodology Incorporation of NASA Satellite DataAdvantages
National Air Toxics Assessment Modeled Census Tract Conc. Modeled Risk Calculations Example Primary Risk Drivers Benzene Arsenic Diesel Formaldehyde Acrolein Associated Health Effects Childhood Cancer Adverse Birth Outcomes Future Priority Data & Model Validation Needs --- Air Toxics
Data & Model Improvement Needs - Urban Hot Spots Distribution/Concentration of Pollutants – Populations at Risk
Many Challenges Ahead Quality Hazard Data Air Toxics Exposure Assessment Methods New/Improved Exposure Models ID Hotspots – At Risk Populations Data Linkage/Analysis Methods In Summary, EPHT Partners Have Made Much Progress, But...
For more information: www.cdc.gov/nceh/tracking Contact us: EPHT@cdc.gov Questions?