Introduction to Geographic Information System
220 likes | 709 Vues
Introduction to Geographic Information System. Qian Yu Department of Geosciences. Outline. What is GIS? GIS data format Understanding scale Global Positioning System GIS application MassGIS data MassGIS data viewer Google Earth. Attribute Information: What is it?. Species: Oak

Introduction to Geographic Information System
E N D
Presentation Transcript
Introduction to Geographic Information System Qian Yu Department of Geosciences
Outline • What is GIS? • GIS data format • Understanding scale • Global Positioning System • GIS application • MassGIS data • MassGIS data viewer • Google Earth
Attribute Information: What is it? Species: Oak Height: 15m Age: 75 Yrs Digitizing Our World • Two types of information: • Location • Attribute Location Information: Where is it? 51°N, 112°W After: ESRI, 2001
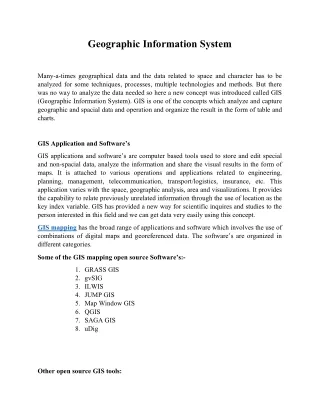
What is GIS? • GI System: • A GIS is an immensely powerful computer mapping and analysis system. • It links geographic locations with information about them so you can create maps and analyze information in new ways. • Techniques for acquisition, storage, manipulation, analysis, and display of spatial data. • GI Science: research with GIS (Applied Science)
GIS Software Tools Database Abstraction + or Simplification The real world Results Subsystems of GIS • Input System • digitizing, scanning, GPS • Database Management System • Geographic Analysis System • Output System
Line 1 Poly 1 1 2 3 4 5 6 7 8 9 1 0 1 5 0 0 2 Y-Axis 3 Pt 1 4 0 0 4 Poly 2 5 3 0 0 1 - River 2 - Pine 3 - Fir 4 - House 6 7 2 0 0 8 9 1 0 0 1 0 1 0 0 2 0 0 3 0 0 4 0 0 5 0 0 X-Axis GIS data format - Geographic Data Representation Raster Vector Point Line Polygon
Scale • Scale: the ratio of the distance on a map to that on the ground between the same two points, in the same units. • Three way to express the scale of a map • Representative fraction 1:1,000,000 • Statement scale One millimeter to one kilometer • Bar scale • Larger scale (ratio) maps show more detail. • GIS data can be displayed at any scale, but GIS data should not be displayed beyond the accuracy at which the data was developed.
1:250,000 smaller scale More detail 1:250,000 1:100,000 mid-scale 1:62,500 1:24,000 larger scale 1:24,000
Global Positioning System • GPS a global satellite based radio-navigation system/technology, consisting of 24 orbiting satellites at an altitude of 20,000 km in space, in six different orbital paths/plane and their ground stations. • 12 hours return interval for each satellite (2 complete orbits around the Earth in less than 24 hours). • Functioning satellite GPS systems NAVSTAR
GPS components • Satellite segment • Control segment Tracking, communications, data gathering, integration, analysis… • User segment GPS receivers
Why is GIS important? Overlay visualization or modeling • Map production • Integration data sources • Spatial analysis and modeling • Exploration and prediction
The application of GIS is limited only by the imagination of those who use it. - Jack Dangermond Daily life Cartography Environmental management 3D visualization Modeling GIS Application
3-D Topography Pioneer Valley
Our daily life need GIS Driving direction GIS for showing where you are and the best route from A to B Locating a store GIS for mapping shops near you
3-D Display View large data sets seamlessly 3D mine with well data 3-D Virtual Model for Urban Planning 3D urban
Hydrodynamic Modeling: Downstream Flooding Sacramento, California, USA (From: U.S. Bureau of Reclamation)
GIS Data in MassGIS • Base Map Data • Vector (point/line/area) • Features such as roads, streams, and political boundaries--relatively permanent, widely used features. • In shape file or coverage • Raster (image data) • Black & White Digital Orthophotos, Scanned USGS Quads, and Coastal Color Orthophotos, • Available in Tiff and MrSID formats. • Environmental Data • Developed, maintained and updated by EOEA and its agencies for the purpose of enforcing environmental regulations or in support of various types of environmental analysis.
MassGIS Runtime Data Viewer • Stand-alone, "light," or scaled-down version of ArcView GIS 3.1.1 • With much of the map-making functionality • Function: • Display all the MassGIS data • Change symbolization of the data and add annotation to the map • Create a map layout with map elements such as a scale bar, north arrow, legend and title • Conduct data query and analysis
Google Earth • Client software of web GIS service. • The planet's imagery and other geographic information are put on server and your computer retrieves data through internet real-time. • Function: • Fly from space to your neighborhood. Type in an address and zoom right in. • Search for schools, parks, restaurants, and hotels. Get driving directions. • Tilt and rotate the view to see 3D terrain and buildings. • Save and share your searches and favorites. Even add your own annotations.