Download
1 / 20
200 likes | 389 Vues
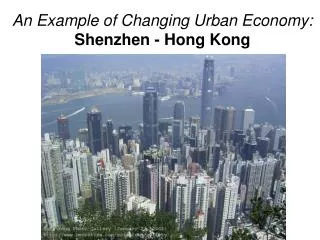
The Structure of Urban Residential Housing Sub-markets of Hong Kong. Presented by Daniel LO, PhD The University of Hong Kong Email: daniello@hku.hk. Introduction. Widely acknowledged that housing submarkets should be adopted as a working hypothesis. Objective:

E N D
The Structure of Urban Residential Housing Sub-markets of Hong Kong Presented by Daniel LO, PhD The University of Hong Kong Email: daniello@hku.hk
Introduction • Widely acknowledged that housing submarkets should be adopted as a working hypothesis. • Objective: • Using geo-referenced property transaction data to define the housing submarket structure of Hong Kong. • Hypothesis: • Submarkets defined by geo-referenced property transaction data can improve forecasting accuracy of housing prices, compared with prevailing submarket structure.
How did we define housing submarkets? • Physically • e.g. structural types (Adair et al. 1996), number of rooms (Schnare and Struyk, 1976), floor areas (Bajic 1985) • Socioeconomically • e.g. income (Strazheim 1975), race and ethnic groups (Palm 1978), religious parishes (Adair et al. 2000) • Spatially/geographically • e.g. natural boundaries (Munro 1986), political boundaries (Adair et al. 1996), school catchment areas (Goodman and Thibodeau 1998), neighborhood characteristics (Galster 1987; Schnare 1980) • Using expert knowledge • Defined by real estate professionals (Michael and Smith 1990) • Hybrid
Problems with previous definitions of housing submarket. • Imposed rather than derived. • No. of submarkets defined, shape and size of the submarkets are fixed. • Cannot capture the dynamics of economic activities involved. • Some neighborhood information are incomplete/unquantifiable/unobservable. • No rule to know that the submarket structure is defined in an optimal way.
Research Method • Following Basu & Thibodeau(1998), Dubin et al. (1998, 1999) and Tu et al. (2007) • Step 1:
Step 2 • Estimate residual variance-covariance matrix, Ω, to reflect residual correlation. • Assume they are isotropic • Choose Spherical Semi-variogram functional form(Basu and Thibodeau 1998, Tu et al. 2007) to estimate the variance and co-variance matrix. • The co-variogram for the distribution of residuals: For all (li, lj) where li=(xi, yi) is the coordinates of dwelling i; e(li) is the hedonic price equation residual for li; li-lj is the Euclidean distance between li and lj. Cov{e(li),e(lj)} is the covariance between two residuals.
Following Matheron (1963),The semi-variogram is given by: • which is an increasing function of the distance between the two dwellings. • γ(h)= γ(-h) • γ(h)θ0 >0 when h0. • θ0 is called the nugget. • The observations will become spatially uncorrelated as the distance h increases. • At h0, γ becomes level-off at C*. h0 is called the range and C* is the sill (the variance of the residuals).
Step 3: Estimate the semi-variogram • The spherical semi-variogram is given by: • where • θ0 is the nugget, • θ0+ θ1 is the sill and • θ2 is the range • Estimated by Method of Moments.
With estimated nugget, sill, and range, together with the distance matrix, the estimates of elements of variance-covariance matrix, Ω, is derived:
Step 4:Clustering the dwellings • Begin with l1 , if the distance between l1 and l2is shorter than the estimated range, then they are grouped into one cluster, say cluster1. • If the distance from l3 tol2 is greater than the estimated range, but the distance from l3 to l1 is shorter than the estimated range, we still group into cluster1. • Repeat the above processes for all observations. • We then can obtain many different clusters based on the spatial autocorrelation structure of the residuals.
Step5: Forming housing submarkets • Applied a standard submarket test, Chow (F) test, to each pair of clusters defined. • Step6: • Adopt weighted mean square test to calculate the forecasting accuracy of the derived submarket structure. • Compare it with that of the prevailing submarket structure.
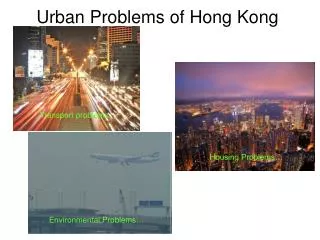
Our data • Urban housing market of Hong Kong, i.e. Hong Kong Island (pop: approx.1,250,000) • All data are geo-coded • January 1, 2006 to December 31, 2006 • 13700 transaction data • Source of data: A database from a local real estate agent
Prevailing urban submarket structure of Hong Kong • Source: Census and Statistic Department of Hong Kong, 2007
Results • More submarkets are defined. • The patterns are dissimilar. • Submarkets need not be geographically adjacent to each other. • Some clusters are unclassified. • Physical boundaries can not delineate submarkets. • R-squared of Hedonic regression increases from 18% to 59% when compared with the prediction against the whole market. • The submarket structure significantly improves forecasting power by 46% if compare with the prediction against whole market, or by 23% if compared with the prediction against prevailing submarkets.
Interpretation and Implication • The prevailing submarket is administratively or politically imposed. • As a result of history, or for the sake of administrative convenience. • Verify that spatial autocorrelation is crucial in modeling housing prices. • Practical applications • Property valuation, housing analysis, government urban planning, etc.
Future Studies • 1 Compare with more submarket structures. • 2 Temporal stability of the submarket structure. • 3 Anisotropic rather than isotropic. • 4 Delineation of submarkets in terms of housing price changes.
Thank you! If you have any comments, please send email to daniello@hku.hk