Download
1 / 28
300 likes | 464 Vues
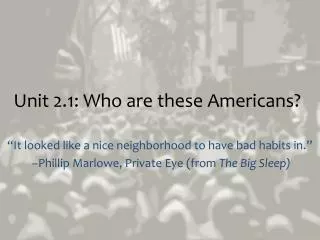
Unit 2.1: Who are these Americans?. “It looked like a nice neighborhood to have bad habits in.” –Phillip Marlowe, Private Eye (from The Big Sleep). The science of studying the objective characteristics of populations and their change over time. Getting to know America. Demography

E N D
Unit 2.1: Who are these Americans? “It looked like a nice neighborhood to have bad habits in.” –Phillip Marlowe, Private Eye (from The Big Sleep)
The science of studying the objective characteristics of populations and their change over time. Getting to know America • Demography • Good at examining…: • Race • Ethnic self-identity • Gender and Parenthood • Vocational Outcomes • Education • Bad at examining…: • Causation of changes • Beliefs, opinions and culture • Most important tools… • Decennial Census • Bureau of the Census Community Reports Project Race is more commonly understood as a physical measure, while ethnicity is a social and cultural identity. For example, people are often both black and latino, or white and latino, and so on. The US Constitution requires that there be an accurate, universal census every ten years to organize taxes and ensure proper representation in the Congress of the United States.
The Family Photo Album The second, or antebellum, wave of immigration also included some slaves, but was much more heavily composed of Irish and German immigrants than the second wave. The first, or settlement wave, of European immigration peaked between 1650-1750, and included African slave populations as well as Western Europeans, especially English, Irish, and some German settlers.
The Family Photo Album The fourth, or post-Cold War, wave of immigration, peaked from 1984-2008, and brought mainly immigrants from Latin America, East Asia, and South Asia. The third, or industrial age, wave of immigrants peaked between 1870-1910, and had far more Eastern and Southern European immigrants, as well as some East Asians.
Over the course of the 20th century, American politics, economic life, and population have become increasingly concentrated in the West, especially California. Denver, Seattle, San Fran. Contemporary America: Where We Live • The Shift West • 1900 - 5% of population • 1950 – 14% of population • 2012 -- 24% of population • Growth of megacities • ‘Gunbelt,’ Immigration • The Shift South • 1900: 33% of population • 1950: 30% • 2012: 38% of population • Invention of cheap air conditioning • ‘Sun Belt’ phenomenon Over the course of the 20th century, American population centers emerged in the formerly rural South and attracted new migrants, increasing the political, social, and economic importance of ‘sunbelt’ and South, especially Texas, Southern California, and Florida. The growth of Atlanta is also a good example.
Increasingly, the course of American presidential elections and Congressional majorities, and which policies are considered important, is determined by a few states with huge populations and influence. Contemporary America: Where We Live • The Megastates • California (37m) • Texas (25m) • New York (19m) • Florida (18m) • Illinois (12m) • Urban, Suburban • The ‘Urban Crisis’ from 1960-2000 • Why suburbs? • Exurban, Rural • Since 2000: Megalopolis and exurbia. • The decline of rural life – <10% outside cities. After the 1960s, larger and larger numbers of Americans left urban cores and moved to suburban areas, those who remained in central cities were increasingly poorer, minorities, and politically inactive. The sympathies of suburban voters and policy needs of suburbia became more important. Here in Richmond, the growth pattern of the West End, Mechanicsville, and, later, Short Pump is a great example of this. So is the growth of the Northern Virginia metro area.
Reapportionment: Power of State Governments • The most important function of the Census? • Nature of Congress: • 2 Senators Per State… • …but only 435 Representatives to go around. • Increasing population means about... • 710,000 people per Rep. • Must ensure equality of representation. • Must avoid obvious or abusive gerrymandering. • Reapportionment • Redistricting The reassignment of the number of Congressional representatives per state – resulting in some states with more Congressional representatives and more electoral votes. The process of drawing the 710,000 person zones that will elect each individual Congressman – this is left to state governments, and often results in weird districts or gerrymandering.
Contemporary America: Race and Ethnicity • Immigration Increase • Since the 1980s, immigration has increased very rapidly. • Latino migration • South Asian migration • East Asian migration • Birth-Rate Increase • Pre-existing families of African-Americans and Latinos have much higher birth rates than pre-existing families of other ethnicities. • Birth rates for all ethnicities still at or above ‘replacement level’. • ‘Minority Majority Nation’ • Remember, demographics have a hard time measuring culture and society. • More like “plurality nation”… The demographic projection that, if current trends continue or decrease only a little bit, the United states will not have any one ethnic or racial group that makes up >50% of the population by 2040-50.
Contemporary America: Wealth and Poverty • Wealth vs Income, Income Gaps • Income disparity is significant • Wealth disparity is huge • Educational Attainment • Large gaps in average education • Extremely large resulting gaps in vocational outcomes. • Crime and the justice system • High incarceration and recidivism rates, concentrated demographically. • High correlation to poor post-incarceration outcomes. Although they seem similar, wealth and income can be very disparate. Owning a house, a large retirement investment, or stocks and bonds is a good example of how built wealth can be separate from income.
Contemporary America: Age and Generations • Cohort Theory • How to define generations is very sticky – years, experiences…? • American Generations • Brainstorm a bit! What are some? • Age Distribution • Also can be called “dependency distribution” – what % of people in a society are non-dependent. • The Graying of America • Modern US age distribution and future projections • Poses major policy problems
Photo Credits Background edited from: http://t3.gstatic.com/images?q=tbn:ANd9GcTd8kGm6Qbx2-wQXtd8qoEHITgfpx_9qVBkm60iBSj9H2MlnU_L Slides: http://upload.wikimedia.org/wikipedia/commons/8/8e/CensusViewer_US_2010_Population_Distribution_by_Census_Tract_Centroid.jpg http://upload.wikimedia.org/wikipedia/commons/thumb/c/ce/US-center-pop.jpg/300px-US-center-pop.jpg http://upload.wikimedia.org/wikipedia/en/thumb/e/e5/Class_US.svg/1000px-Class_US.svg.png http://home.messiah.edu/~jfea/tavern.jpeg http://pndushistory.wikispaces.com/file/view/lg_jamestown-1650s1.jpg/245873907/lg_jamestown-1650s1.jpg http://gawker.com/5787051/how-race-and-ethnicity-is-distributed-across-the-us http://www.flickr.com/photos/walkingsf/5560433168/sizes/l/in/set-72157626354149574/ http://www.census.gov/prod/cen2010/briefs/c2010br-01.pdf http://www.prb.org/Articles/2012/us-population-growth-decline.aspx http://www.prb.org/Publications/ReportsOnAmerica/2011/census-2010.aspx http://www.prb.org/Source/57.4WhatDrivesUSPopulation.pdf http://www.pewsocialtrends.org/2011/10/12/in-a-down-economy-fewer-births/?src=prc-headline http://www.pewsocialtrends.org/2012/05/17/explaining-why-minority-births-now-outnumber-white-births/ http://lasttechage.wordpress.com/2011/11/26/social-inequality-zerosumgames/ http://www.census.gov/hhes/www/income/data/historical/household/ http://www.newthinktank.com/2011/06/average-net-worth-americans/ http://www2.ucsc.edu/whorulesamerica/power/wealth.html http://www.pewsocialtrends.org/2011/07/26/wealth-gaps-rise-to-record-highs-between-whites-blacks-hispanics/ http://topnews.net.nz/images/Population-Growth.jpg http://hmcurrentevents.com/wp-content/uploads/2012/05/SNLEAN792200_242P.jpg http://1.bp.blogspot.com/_d7kKX0XAwsk/TJ0HLJdGYkI/AAAAAAAAAAU/o6f-QRM5E6E/s1600/fast-food-worker.jpg http://www.pewhispanic.org/files/reports/114.pdf http://aging.senate.gov/crs/ss4.pdf http://www.grin.com/en/doc/235629/career-motivation-theory-generational-differences-and-their-impact-on http://www.census.gov/prod/cen2010/briefs/c2010br-03.pdf