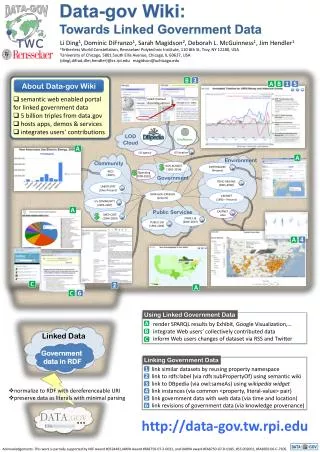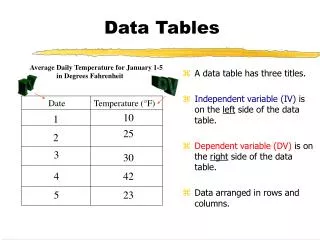
Tables to Linked Data
Tables to Linked Data. Zareen Syed, Tim Finin, Varish Mulwad and Anupam Joshi University of Maryland, Baltimore County. 0. http://ebiquity.umbc.edu/paper/html/id/474/. Age of Big Data . Availability of massive amounts of data is driving many technical advances on the Web and off

Tables to Linked Data
E N D
Presentation Transcript
Tables to Linked Data Zareen Syed, Tim Finin, VarishMulwad and Anupam Joshi University of Maryland, Baltimore County 0 http://ebiquity.umbc.edu/paper/html/id/474/
Age of Big Data • Availability of massive amounts of data is driving many technical advances on the Web and off • Extracting linked data from text and tables will help • Databases & spreadsheets are obvious table sources, but many are in documents and Web pages, too • A recent Google study found over 14B HTML tables M. Cafarella, A. Halevy, D. Wang, E. Wu, Y. Zhang, Webtables: exploring the power of tables on the Web, VLDB, 2008. • Only one in a 1000 had high-quality relational data, but these could be reliably identified by a ML trained classifier, resulting in ~150M tables 1
Goal: Generate linked data @prefix dbp: <http://dbpedia.org/resource/> . @prefix dbpo: <http://dbpedia.org/ontology/> . @prefix xsd: <http://www.w3.org/2001/XMLSchema#> . @prefix cyc: <http://www.cyc.com/2004/06/04/cyc#> \ dbp:Boston dbpo:PopulatedPlace/leaderName dbp:Thomas_Menino; cyc:partOf dbp:Massachusetts; dbpo:populationTotal "610000"^^xsd:integer . dbp:New_York_City … ... • Use classes, properties and instances from a linked data collection, e.g. DBpedia + Cyc + Geonames + ... • Confirm existing facts and discover new ones • Create new entities as needed • Create new relations when possible (harder) 3
What data do we want find relationships between columns dbpo:largestCity dbpo:Massachusettes link cell values to entities link cell values to entities dbpo:Boston 4
What evidence can we find? • Column one’s type is populated place, or is it US city, or a reference to a NBA team? 5
What do we want to extract? • Column one’s type is populated place, or is it US city, or a reference to a NBA team? • Column two’s type is person (or politician?) but is ‘mayor’ a type or a relation and if the later, to what? 5
What do we want to extract? • Column one’s type is populated place, or is it US city, or a reference to a NBA team? • Column two’s type is person (or politician?) but is ‘mayor’ a type or a relation and if the later, to what? • Rows give important evidence too: Menino has a stronger connection to Boston than Massachusetts 5
What do we want to extract? • Column one’s type is populated place, or is it US city, or a reference to a NBA team? • Column two’s type is person (or politician?) but is ‘mayor’ a type or a relation and if the later, to what? • Rows give important evidence too: Menino has a stronger connection to Boston than Massachusetts • Both cities and states have populations, … 5
A Web of Evidence • Table: Column headers, cell values, column position, column adjacency • Language: headers have meaning, synonyms, … • Ontologies: capitalOf is a 1:1 relation between a GPE region and a city • Significance: pageRank-like metrics bias linking • Facts: the LD KB asserts Boston is in MA and that Boston’s population is close to 610K • Graph analysis: PMI between Boston & Menino is much higher than for Massachusetts 6
Approach Predict Class for Columns Query Knowledge base Input: Table Headers and Rows Re query Knowledge base using the new evidence Link cell value to an entity using the new results obtained Identify Relationships between columns Output: Linked Data 7
Wikitology • A hybrid KB of structured & unstructured information extracted from Wikipedia • Augmented with knowledge from DBpedia, Freebase, Yago and Wordnet • The interface via a specialized IR index • Good for systems that need to do a combination of reasoning over text, graphs and RDF data 8
Querying the Knowledge–Base Wikitology For every cell from the table – Cell Value + Column Header + Row Content Baltimore + City + MD + S.Dixon + 640,000 Top N entities, Their Types, Page Rank (We use N = 5) 1.Baltimore_Maryland2.Baltimore_County 3.John_Baltimore 9
Predicting Classes for Columns • Set of Classes per column • Score the classes • Choose the top class from each of the four vocabularies – Dbpedia, Freebase, Wordnet and Yago Score = w x ( 1 / R ) + (1 – w) Page Rank R: Entity’s Rank; E.g. [Baltimore,dbpedia:Area] = 0.89 Select the class that maximizes its sum of score over the entire column [Baltimore, dbpedia:Area] + [Boston, dbpedia:Area] + [New York, dbpedia:Area] = 2.85 dbpedia-owl:Place, dbpedia-owl:Area, yago:AmericanConductors, yago:LivingPeople, dbpedia-owl:PopulatedPlace, dbpedia-owl:Band, dbpedia-owl:Organisation, . . . . . . Column:City Dbpedia:PopulatedPlace Wordnet:City Freebase:Location Yago:CitiesinUnitedStates 10
Linking table cell to entities • Once the classes are predicted, we re-query the knowledge–base with this new evidence • Along with the original query, we also include the predicted types • We pick the highest ranking entity which matches the predicted type from the new results For every cell from the table – Cell Value + Column Header + Row Content + Predicted Column Type Top N entities, Their Types (We use N = 5) Wikitology 11
Preliminary results: entity linking • In a preliminary evaluation, we used 5 Google Squared tables comprising 23 columns and 39 rows, comparing our results with human judgments • The next will be on selected tables from the Google col-lection of >2500 involving 6 domains: bibliography, car, course, country, movie, people 12
Ongoing and Future work • Identifying relationships between columns • Modules for common special cases, e.g. numbers, acronyms, phone numbers, stock symbols, email addresses, URLs, etc. • Replace heuristics by machine learning techniques for combining evidence and clustering • Strategy for dealing with errors 13
Conclusion • There’s lots of data stored in tables: in spread-sheets, databases, Web pages and documents • In some cases we can interpret them and generate a linked data representation • In others we can at least link some cell values to LOD entities • This can help contribute data to the Web in a form that is easy for machines to understand and use 14