Download
1 / 30
310 likes | 564 Vues
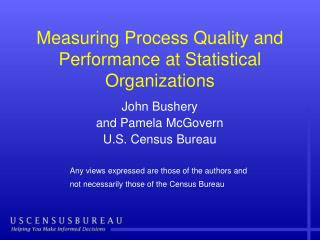
Measuring Process Quality and Performance at Statistical Organizations. John Bushery and Pamela McGovern U.S. Census Bureau Any views expressed are those of the authors and not necessarily those of the Census Bureau. Agenda. Continuous quality improvement in statistical organizations

E N D
Measuring Process Quality and Performance at Statistical Organizations John Bushery and Pamela McGovern U.S. Census Bureau Any views expressed are those of the authors and not necessarily those of the Census Bureau
Agenda • Continuous quality improvement in statistical organizations • CQI and Measurement • Goal-driven measurement demonstration • Conclusion • References
Continuous Quality Improvement • Not common in statistical organizations • Eurostat’s Handbook on improving quality by analysis of process variables found no CQI examples for almost half of the statistical processes • Data analysis • Sample design • Sample implementation • Data management • Dissemination
Continuous Quality Improvement • CQI generally is limited to “repetitive processes” (Morganstein 1997) • Interviewing • Clerical processing (e.g., coding) (Biemer 1994) • Almost no CQI for Morganstein’s “creative processes” • One exception – CQI in writing statistical reports for a pharmaceutical company (Pikounis 2001)
CQI and Measurement • Measurement essential for CQI – but measurement is difficult • Especially difficult for creative processes • Efforts to measure costs of statistical operations unsuccessful (De Vries 1999) • It is hard to find ways to measure the quality of a report (Haselden 2001) • Less difficult for repetitive processes • QC systems usually generate data on process quality • Field and clerical costs are measured and monitored • CQI happens more in repetitive processes than in creative processes
Goal-Driven Measurement • Systematic approach to establish process measurement • Adapted from Software Engineering • Goal-Driven Software Measurement – A Guidebook (http://www.sei.cmu.edu/library/abstracts/reports/96hb002.cfm) • Works for any discipline and for any process
Overcome the Measurement ChallengeDemonstration – Statistical Reports Several processes involved in producing statistical reports • Plan the analysis and report • Obtain data files • Prepare the data for analysis (e.g., match files, recode data) • Analyze the data and obtain results (e.g., produce models, conduct hypothesis testing) • Write the report (and re-write it) • Review, comment on, and approve the report • Disseminate the report
Measures for Writing Statistical Reports • Our focus – process 5 (Write report) • Must also consider process 6 (Review, comment, approve) • The Review process generates important measures about the Writing process • Writing is one of the last processes • Input from earlier processes will affect the Writing process • CQI projects might target an earlier process
Goal-driven Measurement • Seven steps • Business goals • Process entities • Sub-goals • Quantifiable questions and indicators • Data elements • Measurement plan • Implementation • The steps in the Guidebook are somewhat different
Goal-driven Measurement Step 1 Step 1: Identify the business goals • Outcomes that benefit the organization stated in high-level terms • Business goals for “Writing statistical reports: • Reduce costs • Reduce cycle time
Goal-driven Measurement Step 2 Step 2: Document the process / identify the entities • A documented process is the foundation for CQI • Identify important process entities • Process entities are candidates for what should be measured
Goal-driven Measurement Step 2 Step 2: Document the process / identify the entities Examples of process entities
Goal-driven Measurement Step 3 Step 3: Identify the sub-goals • Restate the high-level business goals as specific desired outcomes of the process being improved • Sub-goal for “Writing statistical reports” • Reduce errors in initial draft reports (reduces rework, saving money and cycle time)
Goal-driven Measurement Step 4 Step 4: Develop quantifiable questions and indicators • Quantifiable questions • Ask about the attributes of entities in the process • The answers will help achieve the sub-goal • The answers are numerical
Goal-driven Measurement Step 4 • Examples of quantifiable questions • How many errors? • What types of errors occur in each type of report? • Which processes generate the errors? • Which steps of the review process detect each type of error? • How many staff hours to fix the errors? • Question 5 provides information on whether the sub-goal and the business goal are being achieved.
Goal-driven Measurement Step 4 • Indicators • Communicate the answers to the quantifiable questions. • Help identify hidden assumptions and possible problems in the underlying data element • Examples of indicators: • Distribution of errors by type • Distribution of errors by report type • Distribution of errors by the process that generated them • Distribution of errors by the review step that found them • Staff hours to fix the errors by report type • Graphs, charts, estimates, tables, time series
Goal-driven Measurement Step 4 Graphic example of indicator #2
Goal-driven Measurement Step 5 Step 5: Identify and define data elements • Data elements are the measurements needed to construct the indicators • Two parts to this step • Identify the data elements • Construct operational definitions
Goal-driven Measurement Step 5 • One data element measures one attribute of the entity • The figure below maps data elements to the indicators • Elements used in several indicators are more useful
Goal-driven Measurement Step 5 • Operational definitions of data elements • Clearly communicate what is being measured • Promote reproducibility of measures • Promote consistent conclusions from the data • Use a checklist • Captures everything to be done to collect the data • Identifies what is included and what is not included in the measure
Goal-driven Measurement Step 6 Step 6: Develop a measurement plan • Four parts to this step • Gather information about what is being measured • Identify any changes needed to obtain the data • Plan the actions needed to implement the measures • Document the measurement plan
Goal-driven Measurement Step 6 Step 6. Part 1: Gather information to determine what data are already available and which processes generate data • Ask questions like: • What data elements are needed for the measures? • What data elements are already being collected? • How are these data collected? • What processes provide the data? • How are the data stored and reported? • A common mistake is to start at this step, without identifying goals – “How can we use these data?”
Goal-driven Measurement Step 6 Step 6. Part 2: Identify the changes needed to obtain the data • Some existing data might satisfy the measurement needs “as is” • Some processes may need to be changed • To modify how the existing data are collected • To generate any new data required • New processes may be needed • To produce or modify the data
Goal-driven Measurement Step 6 Step 6. Part 3: Plan the actions that must be taken to obtain the data • Describe products to generate and tasks to perform • Define the methods to use to collect and report the data • Identify the tools needed to collect, report, and store the data • Set the timing and frequency of measurement • Set schedule and determine resources needed to implement • Determine how to monitor implementation progress • Identify who will use the data • Describe how the data will be analyzed and results reported
Goal-driven Measurement Step 6 Step 6. Part 4: Document the plan • Background, purpose, scope and goals (business goals and sub-goals) • Assumptions and risks • How the measurement processes will operate on a production basis • How the measurement activities relate to the organization’s other processes • All the actions needed to implement the measures (described in Step 6.3)
Goal-driven Measurement Step 7 Step 7: Implement the measurement plan • Treat the measurement project like a “real project” • Give it sufficient priority • Monitor implementation and stay on track • Top management support is essential – just like for any other improvement initiative
Conclusion • CQI requires good data – measurement • Measures should be derived from goals • Without goals, measures may waste resources • Measure to get the information that helps achieve the goals • Don’t decide what to measure based solely on convenience • Don’t rely too heavily on customer satisfaction surveys – they measure symptoms • Use operational definitions • Promote better understanding by those using the measures • Promote reproducibility
References • Aitken, A., Hörngren, J., Jones, N., Lewis, D., Zilhão, M., “Handbook on improving quality by analysis of process variables,” European Commission, July 7, 2004. http://epp.eurostat.ec.europa.eu/cache/ITY_PUBLIC/G0-LEG-20040510/EN/G0-LEG-20040510-EN.PDF • Basili, V., “Applying the Goal/Question/Metric Paradigm in the Experience Factory,” Software Quality Assurance and Measurement: Worldwide Perspective, N. Fenton, R. Whitty, and Y. Lizuka, eds., International Thomson Computer Press, pp. 21-44, 1995. • Biemer, P. and Caspar, R., “Continuous Quality Improvement for Survey Operations: Some General Principles and Applications,” Journal of Official Statistics, Vol. 10. No.3, 1994, pp. 307-326. • De Vries, W., “Are We Measuring up...? Questions on the Performance of National Statistical Systems,” International Statistical Review / Revue Internationale de Statistique, Vol. 67, No. 1 (April 1999), pp. 63-77, International Statistical Institute (ISI). • Dransfield, S., Fisher, N., and Vogel, N., “Using Statistics and Statistical Thinking to Improve Organisational Performance,” International Statistical Review / Revue Internationale de Statistique, Vol. 67, No. 2 (August, 1999), pp. 99-122.
References • Haselden, L. and White, A., “Developing new quality indicators in social surveys,” Proceedings of the International Conference on Quality in Official Statistics, 2001, CD-33-1. • Kristensen, K., Dahlgaard, J., and Kanji, G., “TQM Leadership,” Total Quality Management, Proceedings of the First World Congress, edited by G.K. Kanji, London: Chapman & Hall, 1995. • Morganstein, D. and Marker, D., “Continuous Quality Improvement in Statistical Agencies,” Survey Measurement and Process Quality, edited by Lyberg, Biemer, Collins, de Leeuw, Dippo, Schwarz, Trewin, John Wiley & Sons, Inc., 1997, pp 475-500. • Park, R.E., Goethert, W.B., and Florac, W.A., Goal-Driven Software Measurement – A Guidebook, Carnegie Mellon University, Software Engineering Institute, 1996. http://www.sei.cmu.edu/library/abstracts/reports/96hb002.cfm • Pikounis, V., Antonellol, J., Moore, D., Senderak, E., and Soper, K., “Practicing What We Preach: The Application of Continuous Improvement in a Preclinical Statistics Department at a Pharmaceutical Company,” Journal of Official Statistics, Vol. 17, No. 1, 2001, pp. 187-206. • Sundgren, B., “Documentation and Quality in Official Statistics,” Proceedings of the International Conference on Quality in Official Statistics, 2001, CD-22-2.


![Seven Quality Tools [Statistical Process Control]](https://cdn3.slideserve.com/6416179/seven-quality-tools-statistical-process-control-dt.jpg)