Download
1 / 19
190 likes | 328 Vues
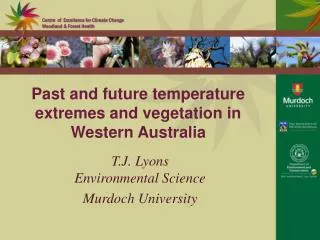
Space-time trends in temperature extremes in south central Sweden. Peter Guttorp Norsk Regnesentral University of Washington. Acknowledgements. Joint work with Peter Craigmile , The Ohio State University Data from Swedish Meteorological and Hydrological Institute

E N D
Space-time trends in temperature extremes in south centralSweden Peter Guttorp NorskRegnesentral University of Washington
Acknowledgements • Joint work with Peter Craigmile, The Ohio State University • Data from Swedish Meteorological and Hydrological Institute • Partial support from National Science Foundation
Outline • Data analysis • Marginal fits • Spatial model • Model assessment
IPCC model results (AR4 WG1 Ch.11) • Fewer frost days • VL (consistent across model projections) • Decrease in number of days with below-freezing temperatures everywhere • Fewer cold outbreaks; fewer, shorter, less intense cold spells / cold extremes in winter • VL (consistent across model projections) • Northern Europe, South Asia, East Asia • L (consistent with warmer mean temperatures) • Most other regions • Reduced diurnal temperature range • L (consistent across model projections) • Over most continental regions, night temperatures increase faster than day temperatures
Data set • Synoptic stations in south central Sweden with 48 years of data
GEV fits • Running estimate of 29 years for Sveg • Suggests linear fit for
Dependence between stations Common coldest day in 48 years 5 common to all 4 northern stations
Spatial model • where • Allows borrowing estimation strength from other sites • Can include more sites in analysis
Trend estimates Posterior probability of slope ≤ 0 is very small everywhere