Download
1 / 23
230 likes | 390 Vues
Summary of observed changes in precipitation and temperature extremes (D9). Objective. Are extremes becoming more severe? Are they becoming more frequent? How is the spatial pattern of the observed changes? Is there seasonal variability in the changes?. Method of analysis. Time series of

E N D
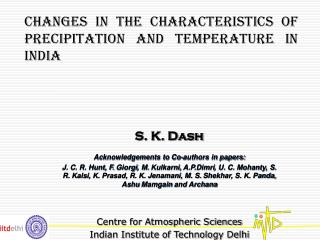
Summary of observed changes in precipitation and temperature extremes (D9)
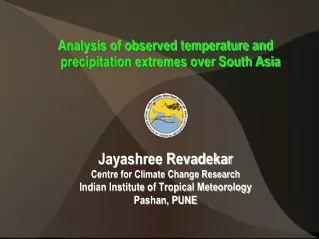
Objective • Are extremes becoming more severe? • Are they becoming more frequent? • How is the spatial pattern of the observed changes? • Is there seasonal variability in the changes?
Method of analysis • Time series of • Daily precipitation, • Daily max/min temperatures • Definition of indices that correspond to extremes • Calculation of annual seasonal values of the indices • Linear regression applied on the time series of the calculated indices • Non-parametric test of significance
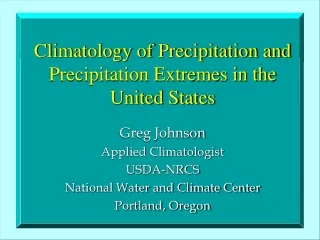
Extreme indices investigated Designation Description Precipitation related indices Prec90p 90th percentile of rainday amounts (mm/day) 644R5d Greatest 5-day total rainfall 646SDII Simple Daily Intensity (rain per rainday) 641CDD Max no. of consecutive dry days 691R90T % of total rainfall from events > long-term 90th percentile 692R90N No. of events > long-term 90th percentile of raindays Temperature related indices Tmax90p Tmax 90th percentile Tmin10p Tmin 10th percentile 125Fd Number of frost days Tmin < 0 °C 144HWDI Heat wave Duration
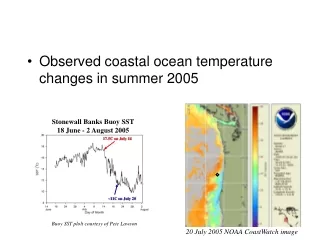
Results Europe Heavy precipitation extremes: Winter • Increased in central Europe, the UK and Scandinavia. • Decreased in Eastern Europe, Greece, and western Iberian Peninsula. Summer • increased across northern Scandinavia and Russia • decreased across the UK and NE Europe • increased through SW Europe • decreased across the northern Iberian Peninsula.
Dry day persistence Winter • increased in the southern part of the region • decreased in the north • the increase is generally greater than the decrease Summer • Less coherent signal • Most stations in the central part, the UK, and southern Scandinavia showed an increase.
Temperature extremes Winter • Extreme maximum temperature increased over most of the region except the SE • Extreme minimum temperature increased over the entire region apart from small decreases in parts of Greece, the Iberian Peninsula and Scandinavia • Extreme minimum temperature increased to a larger degree than the corresponding extreme maximum temperature Summer • Extreme maximum temperature incresed in most area of the region except in northern Scandinavia, Eastern Europe, and Russia • Extreme minimum temperature increaded in most areas except that a few stations showed a decrease
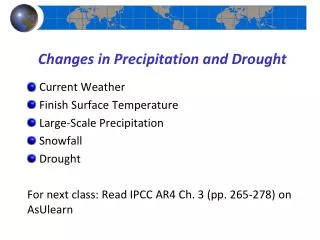
Precipitation trends / Floods • Areal precipitation vs. Point precipitation • Simultaneous occurrence of extremes • Differences between trends corresponding to nearby stations • Trend Interpolation or Interpolation Trend
Trends in the areal precipitation indices Point scale Grid size of 10km x10km Winter trends in the 5 day total rainfall amount
Summary • There are significant trends in the extreme indices • Variability increases (Ex.: dry day duration and 5 day sums both increase) • Trends in downscaled series